OPQ Box Hardware Design
The goal of OPQ Box is to monitor voltage, frequency, THD, and Transients, and detect departures from nominal levels. It accomplishes this by sampling the waveform 256 times per cycle, extracting power quality measures (including frequency, RMS voltage, and THD), and then transmitting data about these measures to an OPQ Cloud instance.
By default, an OPQ Box sends data to OPQ Cloud approximately once a second. This data includes low fidelity voltage and frequency data, and also indicates that the Box is functioning.
When a power quality disturbance is detected, OPQ Box can transmit high fidelity voltage and frequency data to OPQ Cloud.
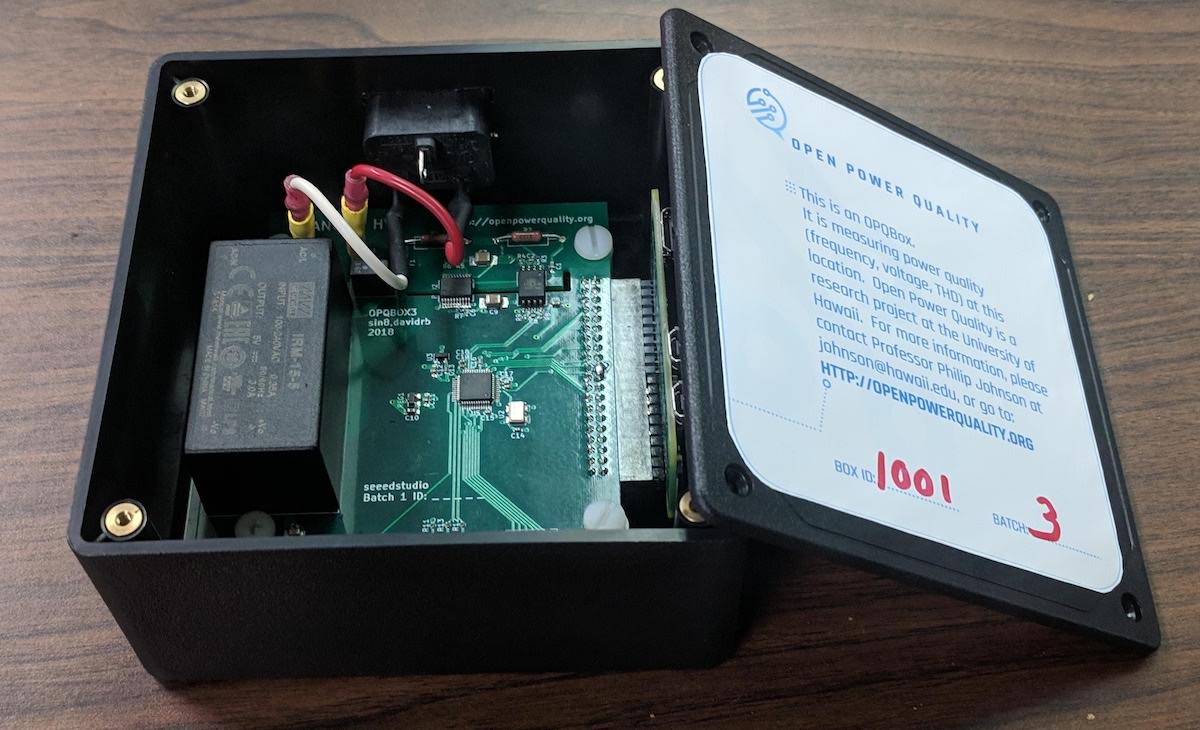
Currently, an OPQ Box device looks like this:

Safety
The schematics for the latest version of the device can be found here. These schematics have been informally reviewed by multiple licensed electrical engineers for both functionality and safety.
An annotated bill of materials is located here.
The list of components composing the hot side of the device is as follows:
| Component | Datasheet | Description | Certification |
|---|---|---|---|
| IRM-15-5 | here | (120V_{ac}) to 5V isolated DC-DC converter. | UL60950-1, EN60950-1 |
| AMC1100 | here | Isolation Transformer. | UL1577,IEC60747-5-2 |
| ADuM5010 | here | Isolated DC-DC. | UL 1577 |
| CMF551 | here | Flameproof resistor. | MIL-STD-202 tested |
| RSTA-1-BULK | here | Main system fuse. | IEC 60127-3 |
| 0466.125NR | here | Measurement system fuse | ISO 9001:2015, ISO 14001:2015 |
At this time, we have not sought UL Listing for the box as a whole.
Hardware components
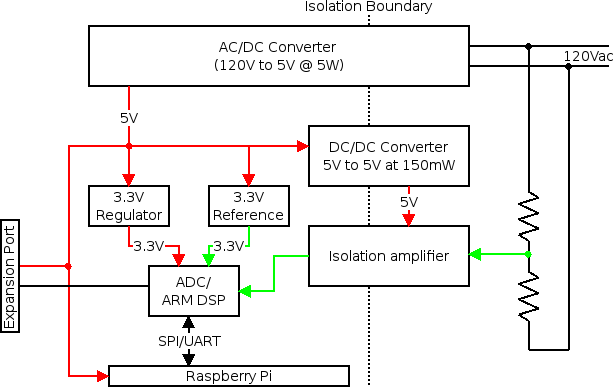
The following diagram illustrates OPQ Box hardware components,

The power system of OPQ Box electrically isolates most of the device from the AC mains power. An isolated AC-DC converter generates \(5V_{dc}\) from the mains \(120V_{ac}\).
5V is used to power: (a) the Raspberry Pi, (b) the equipment connected to the expansion port, (c) the 3.3V regulators and voltage reference, and (d) an isolated DC/DC converter.
3.3V is used to power: (a) the isolated end of the isolation amplifier and (b) the STM32F3 analog to digital converter/digital signal processor (ADC/DSP).
The hot side of the isolation amplifier is powered from the isolated DC/DC converter. This allows OPQ Box to function with a battery attached to the expansion port, so that it may retain data and continue to operate during a power outage.
The analog signal path of the OPQ Box is complicated by the fact that the STM32F3 ADC/DSP is electrically isolated from the mains power. Previous versions of the OPQ Box overcame this by employing small circuit board mount isolation transformer. Unfortunately, it was found that the frequency response of these transformers varied wildly between individuals, thus incurring a lengthy calibration process for each device. The current OPQ Box design solves this issue by using an AMC1100 isolation amplifier as the isolation component.
Internally, AMC1100 consists of a single die comprised of a \(\Sigma\Delta\) analog to digital and digital to analog converters. These converters are separated by a silicon glass region on the integrated circuit which acts as a coupling capacitor. Since the signal passes the isolation boundary as a \(\Sigma\Delta\) encoded digital signal, it incurs no distortion and no additional calibration is required.
In order to match the dynamic range of the AMC1100, the \(120V_{ac}\) is passed through a resistor divider to attenuate it to \(120mV_{ac}\). The input and output of the isolation amplifier is filtered with a passive first order anti-aliasing filter. The isolated signal is then digitized via a 16bit ADC of the STM32F3 DSP at \(12 KSps\), which gives 200 data samples per grid cycle. Internally, the digitization process runs asynchronously with the respect to the the DSP CPU, which minimizes timing jitter. We verified that the sampling jitter of the ADC is less then 1us, however due to limited precision equipment an exact figure was not established. The data stream in its digital form is transferred to the Raspberry Pi single board computer (SBC) for analysis.
Software components
Here is an illustration of the OPQ Box software stack:

A Raspberry Pi is responsible for signal analysis and anomaly detection. The Raspberry Pi model used in OPQ Box is the Pi Zero W equipped with 256MB of main memory and a single core 1GHz ARM11 CPU. The Pi Zero W comes equipped with an on-board 802.11n WIFI transceiver, which removes the need for an external WIFI dongle.
The software stack aims to deliver a full featured power quality analysis framework despite its limited hardware capabilities. Digital data is transferred from the DSP to the Raspberry Pi via Serial Peripheral Interface, with the Pi acting as the master and the DSP as a slave device. A hardware interrupt line is used to inform Pi software that the DSP is ready for the data transfer. During the initial design of OPQ Box, SPI data transfer was attempted in userland. However, due to the lack of support for DMA in the SPI kernel-to-userland bridge, a large portion of the CPU time was spent facilitating data transfer, resulting in degraded analysis performance as well as missed data samples.
The current version of OPQ Box utilizes a kernel driver for management of SPI bus. Internally, the OPQ driver maintains a ring buffer of 16 windows, each 200 data samples in size. Upon receiving an interrupt for the DSP, the CPU sets up DMA transfer and the DMA engine transfers a 200 sample window into the kernel memory without CPU interaction. This scheme means that the CPU only needs to service 60 interrupts a second, with each interrupt requiring on the order of 100 instructions, yielding the CPU utilization of less then 1%in normal operation. In contrast, userland applications communicate with the kernel driver using a file descriptor, where every write system call yields 200 samples of raw waveform. As a result, the smallest window that a userland application could process is a single AC cycle of the grid mains.
The userland component of OPQ Box is a multi-threaded extensible analysis framework called Triggering. The reader thread is responsible for transferring and accumulating data from the kernel driver. The smallest data buffer that the Triggering application processes at any given time is 10 grid cycles or 2k samples. Once the cycles are transfered to the userland and timestamped, they are passed to the analysis thread for feature extraction, as well as to the Raw Data Ring Buffer (RDRB). Since internally all data is addressed using shared pointers, during data duplication no copying is required. RDRS is capable of buffering up to an hour of power data before it's overwritten. Thus, the maximum size of RDBS is 100MB.
The analysis thread of the Triggering application performs feature extraction on the raw data windows of 2000 samples. At the moment only two metrics are calculated: fundamental frequency and RMS voltage.
Frequency calculation
Fundamental frequency is calculated by computing the zero crossings of the AC waveform. Since a sinusoid will have two zero crossings for a full cycle the frequency can be calculated as:
$$ f = \frac{1}{\frac{2}{n}\sum\limits_{k=0}^{k=n}{\Delta t_{k}}} $$
Where the \(\Delta t_{k}\) is the k'th time between two adjacent zero crossings.
In order to improve the accuracy of the frequency calculation, one must first filter out as much of out of phase noise as possible. Since our sampling rate is quite high (12kSps) and the fundamental frequency is quite low (60Hz), it is computationally expensive to perform this filtering in a single step. Instead, filtering is accomplished via a set of two finite impulse response (FIR) filters as illustrated below:

First, the downsampling filter is applied to the raw waveform, which results in the frequency response shown in (a). As is evident by the plot, the frequency content of the result is 0-600Hz. Therefore, it can be downsampled to the \(\frac{N}{10}\), or 200 samples without aliasing.
Second, the low pass filter is applied to the downsampled waveform with the frequency response shown in (b). This resulting frequency content is 0-100Hz, thus all of the higher frequency harmonics and noise are removed.
Finally the twice filtered downsampled waveform is used to estimate the fundamental frequency according to the above equation for frequency calculation. The zero crossings themselves are calculated by using linear interpolation between two points which bracket the time axis.
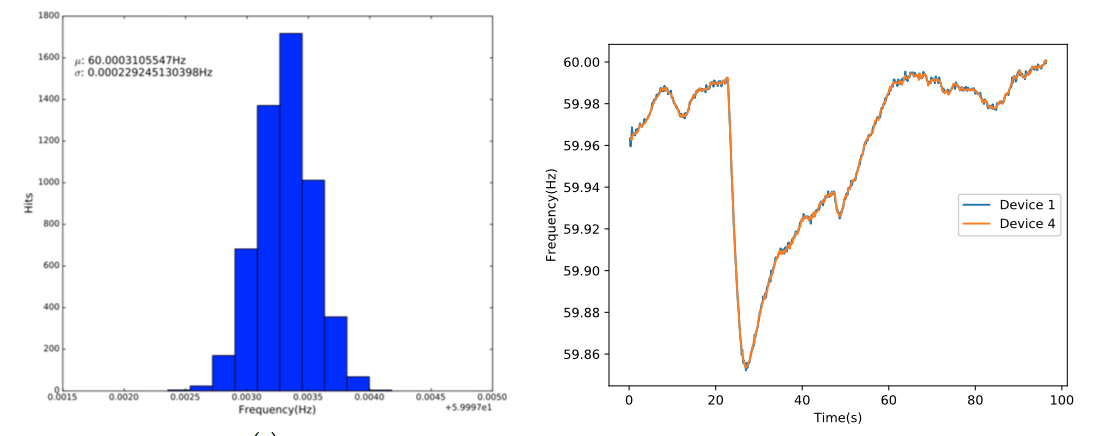
In order to determine the error in our frequency measurement, a function generator (SIGLENT SDG1025) was used to inject a \(60Hz\) \(120mV_{pp}\) superimposed with 1% white noise into the input of the AMC1100 anti-aliasing filter, bypassing the voltage divider. The resulting frequencies were calculated and recorded by OPQ Box and the resulting histogram as shown below in (a):

We found that OPQ Box overestimated the frequency by \(300\mu Hz\) with \(\sigma = 230\mu Hz\). All electrical generation systems connected to the grid run synchronously with each other, meaning that while small variations in voltage are common across locations, the fundamental frequency and phase must remain strictly in sync. This effect is demonstrated in (b) above, which is a frequency fluctuation event recorded on November 8, 2017. While the two devices were separated by ten miles, their frequency measurements track closely together.
Voltage calculation
Root mean square voltage (\(V_{rms}\)) in electrical power is the equivalent value of DC voltage which would dissipate the same power in the resistive load. \(V_{rms}\) is a convenient measure for detecting voltage sags and swells, since they result in nominally higher and lower computed value. For the sinusoidal signal \(V_{rms}\) can be calculated from the peak to peak value (\(V_{pp}\)) as:
$$ V_{rms} = \frac{V_{pp}}{2\sqrt{2}} $$
It is common for multimeters to employ the equation above for computing \(V_{rms}\). However this equation will only work for a perfect sinusoid, and thus does not result in a suitable metric for identifying power quality disturbances. Instead, OPQ Box computes \(V_{rms}\) as follows:
$$ V_{rms} = \sqrt{\frac{1}{n}\sum\limits_{k=0}^{k=n}V_{k}^{2}} $$
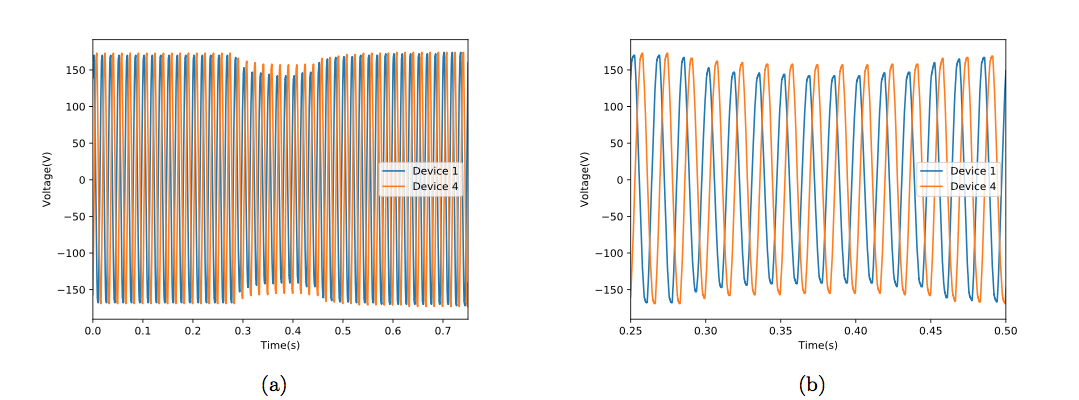
Similarly to the frequency calculation, OPQ Box uses a 10 cycle window for a single \(V_{rms}\) calculation. However, unlike the frequency calculation, the input is not filtered a priori. An example of a power quality disturbance which exhibits low \(V_{rms}\) is shown in (a) below:

These disturbances in voltage are the result of a lighting strike recorded by two OPQ Boxes on Nov 1, 2017. Figure (b) in the above diagram illustrates synchronization error, to be further discussed below.
Data transmission
OPQ Box transmits data on fundamental frequency and \(V_{rms}\) to the Makai service for storage and analysis. Data transmission is handled using the ZeroMG (ZMQ) software stack with Curve25519 elliptic curve encryption. Each device holds a unique of private and public keys, as well as the server's public key, allowing both the Makai service and the OPQ Box to verify its peer. Internally, metrics transmission uses ZMQ's protocol. This protocol is a publish-subscribe, one-to-many topology, with each message containing the topic and a payload. Additionally, the ZMQ pub-sub topology allows multiple sub peers with subscriptions to forward to the publisher automatically via a side channel. This allows the aggregation service to be spread across multiple nodes with minimal network overhead.
If the aggregation service determines that an anomaly has occurred, it is able to request raw waveform from the OPQ Box RDRB via a separate ZMQ pub-sub channel. If the RDRB buffer contains data for the requested temporal range, OPQ Box will send the available data to the aggregation service via a push-pull 0MQ channel.
Synchronization
In order to detect grid-wide events, all of the OPQ Boxes on an OPQ network need to maintain a synchronized time reference. Time synchronization across multiple OPQ Boxes is accomplished using Network Time Protocol. (As an alternative to NTP, the OPQ Box expansion port supports a GPS receiver. However, using GPS makes OPQ Box less flexible with respect to its installation location. GPS receivers require line of sight to the sky, and since there is no on-board real-time clock, every power interruption requires a GPS cold start.)
NTP performance has been tested against GPS, indicating a time error of \(8ms\pm 5ms\). This is typical for NTP running over the Internet with a reasonably close NTP server. An example of this synchronization error is shown (b) above. With a large coincidental \(V_{pp}\) drop across two devices, a 7ms phase error is clearly visible. We believe that this error is small enough for OPQ to correctly detect grid-wide events by comparing other aspects of the anomalies to see if they are similar even if their timestamps differ by 7-10ms.
