OPQ Cloud User Guide
For non-developers, all access to OPQ Cloud is via a web application called OPQ View. So, the remainder of this user guide will refer to "OPQ View" rather than "OPQ Cloud" as a way to clarify the actual user interface system. (OPQ Cloud services such as Mauka and Makai have low-level interfaces for use by developers. These developer-level interfaces are documented as part of their respective services.)
Landing Page
The first OPQ View page you normally encounter is the landing page, which looks like this:
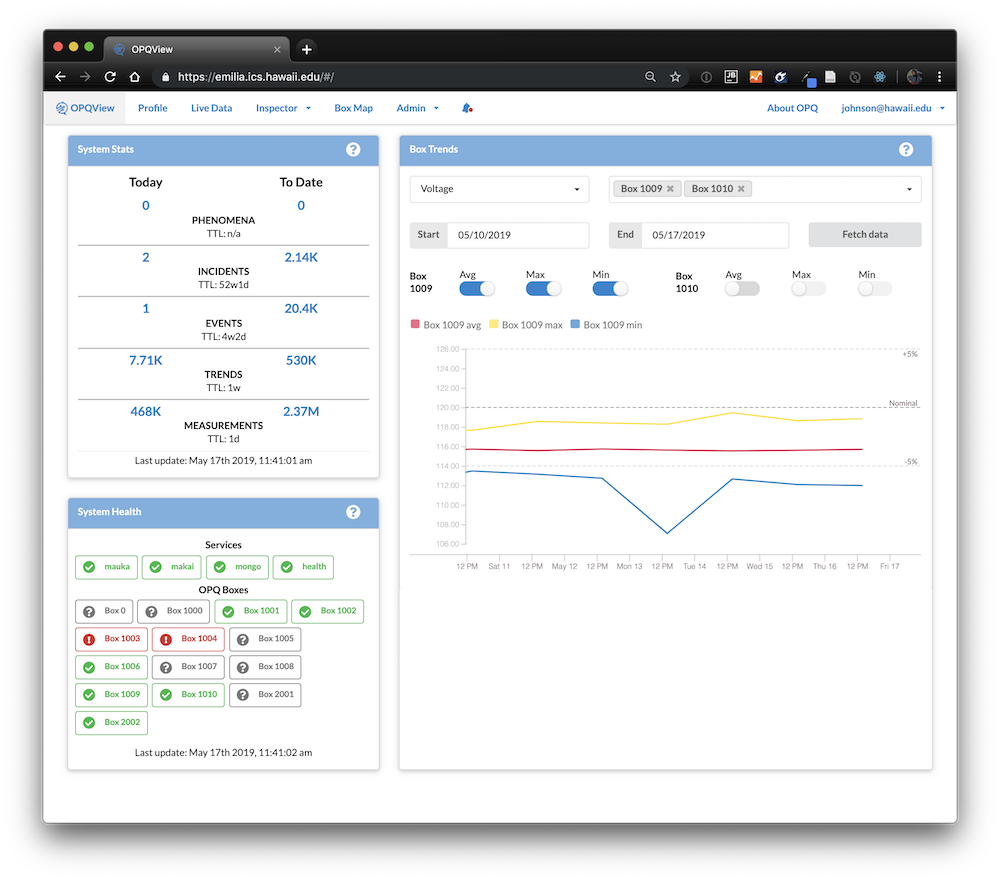
The landing page provides "public" data about the state of the OPQ system. It is public in the sense that anyone who can retrieve the top-level URL for OPQ View can see this information without further authorization or authentication. If you need this page to be private, please put the URL behind a firewall.
System Stats
System Stats shows summary statistics about the number of objects at each of the five "levels" of the OPQ data hierarchy.
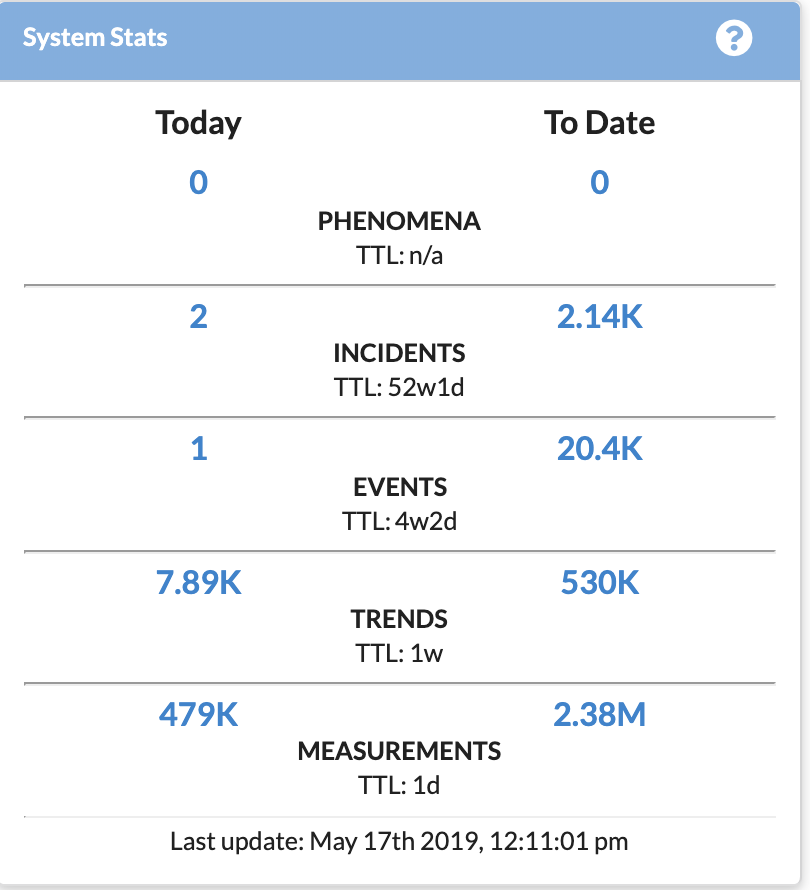
This component automatically refreshes every ten seconds with updated counts. It also displays the current TTL (time to live) value for objects at each level of the hierarchy.
For details on this data hierarchy, please see OPQ Information Architecture.
System Health
System Health provides a visual indication of the current status of OPQ services and boxes.
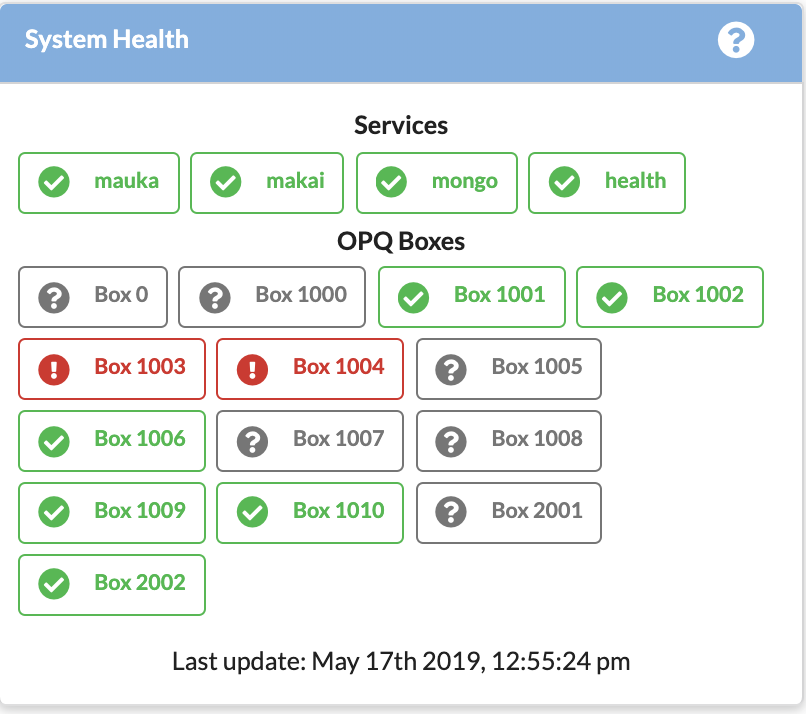
For OPQ to function correctly, all of its services and boxes should be functioning. Services can either be 'up' (green), 'down' (red), or 'unknown' (grey). All services should always be up.
Boxes can be 'up' (green), 'down' (red), 'unknown' (grey), or 'unplugged' (yellow). When a user wants a box to be registered in the system but isn't using it currently, they can set its status to unplugged to indicate that the lack of data transmission is not an indication of system malfunction. Boxes should always be 'up' or 'unplugged'.
Box Trends
Box Trends uses Trend data to show changes in frequency, voltage, or THD for one or more boxes over time.
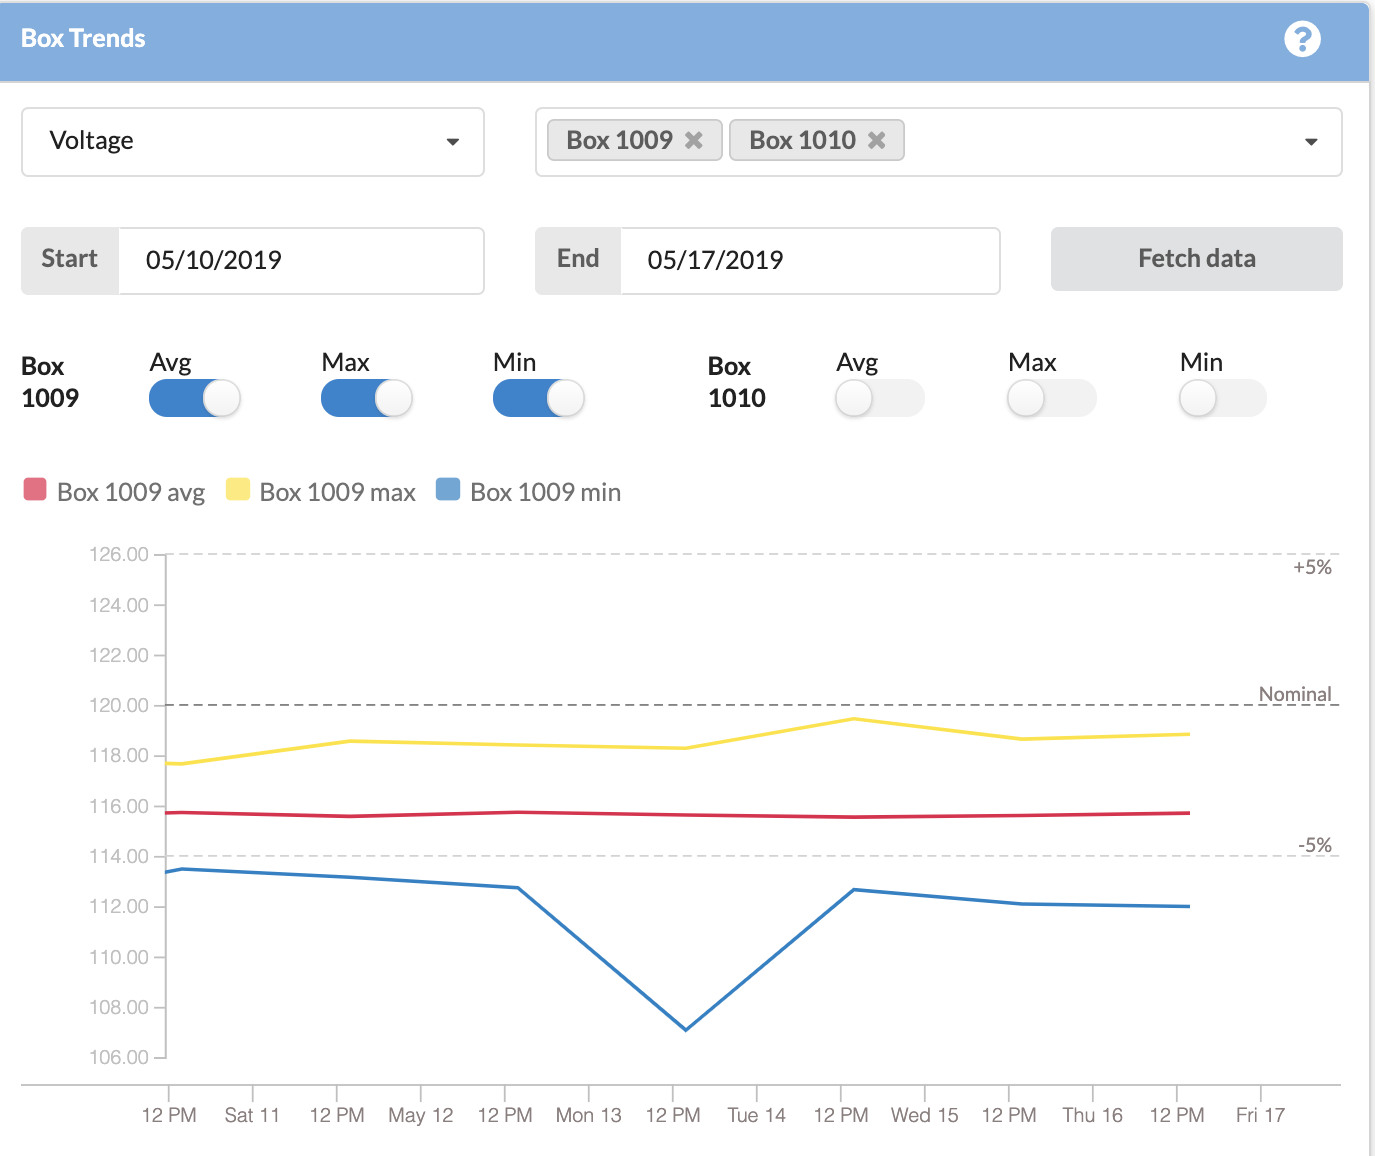
Measurement control: select either voltage, frequency, or THD.
Boxes control: select one or more boxes whose values you wish to graph over time. Once you specify a box, you will be able to specify whether you want to graph its maximum, minimum, or average value of the measurement.
Start and End controls: Specify the start and end date for the visualization.
Fetch Data button: Click this button to see the visualization.
This visualization supports panning and zooming. Scroll the mouse up or down over the visualization to change the time interval. Click and drag right or left to change the window of time displayed.
Box Map Page
The Box Map page provides a location-oriented perspective on the OPQ Boxes associated with the current user.
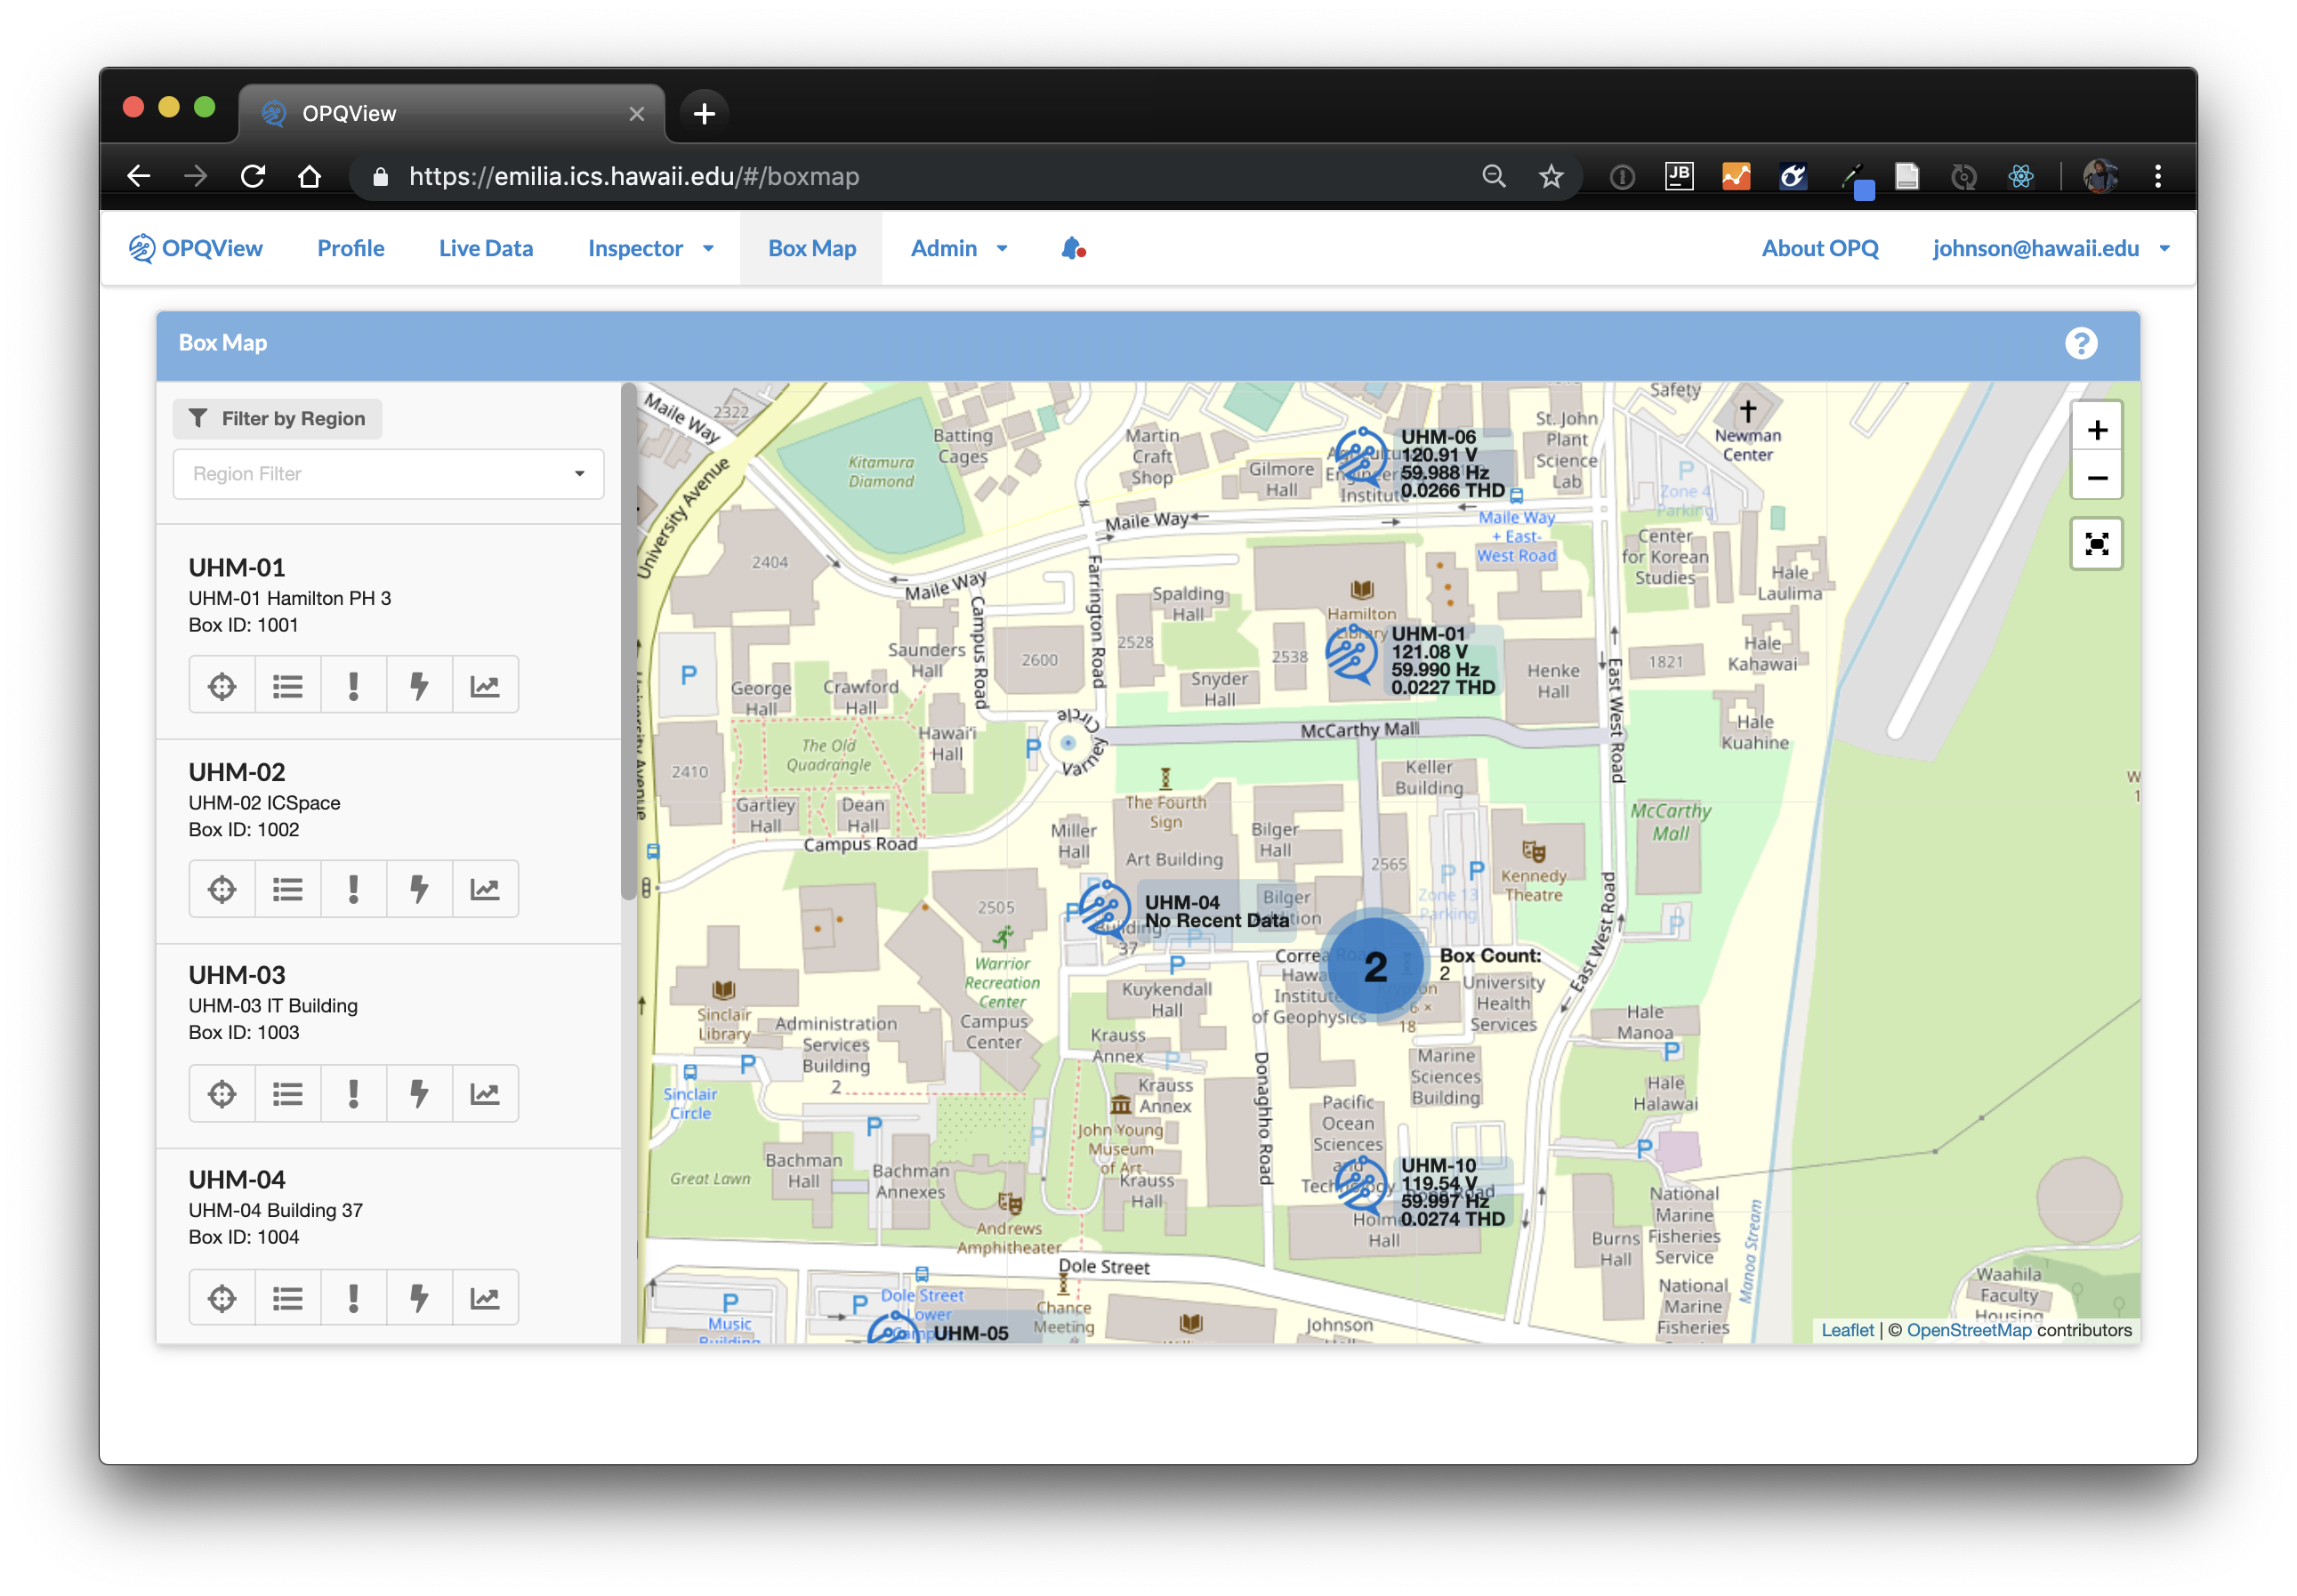
As the above screen shot illustrates, boxes are represented either by an OPQ icon and current power data (when there are no additional boxes nearby) or by a "roll-up" consisting or a circle (when two or more boxes are present nearby with respect to that zoom level). When boxes are represented by a circle, zooming in with eventually reveal their location.
Box Details
The left hand pane contains entries for all boxes available to the current user with five icon-based buttons:
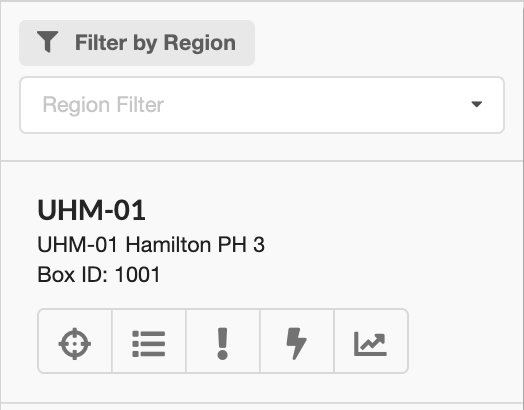
The "zoom" icon repositions the map to display this box. The "list" icon provides additional box details. The "exclamation point" icon takes you to the Event Inspector to view the Events associated with this box (if any). The "lightning" icon takes you to the Incident Inspector to view any Incidents associated with this box. Finally, the "graph" icon takes you to the Live Data Inspector to see the Measurements being sent by this box to OPQ Cloud in real time.
You must be logged in to access this page.
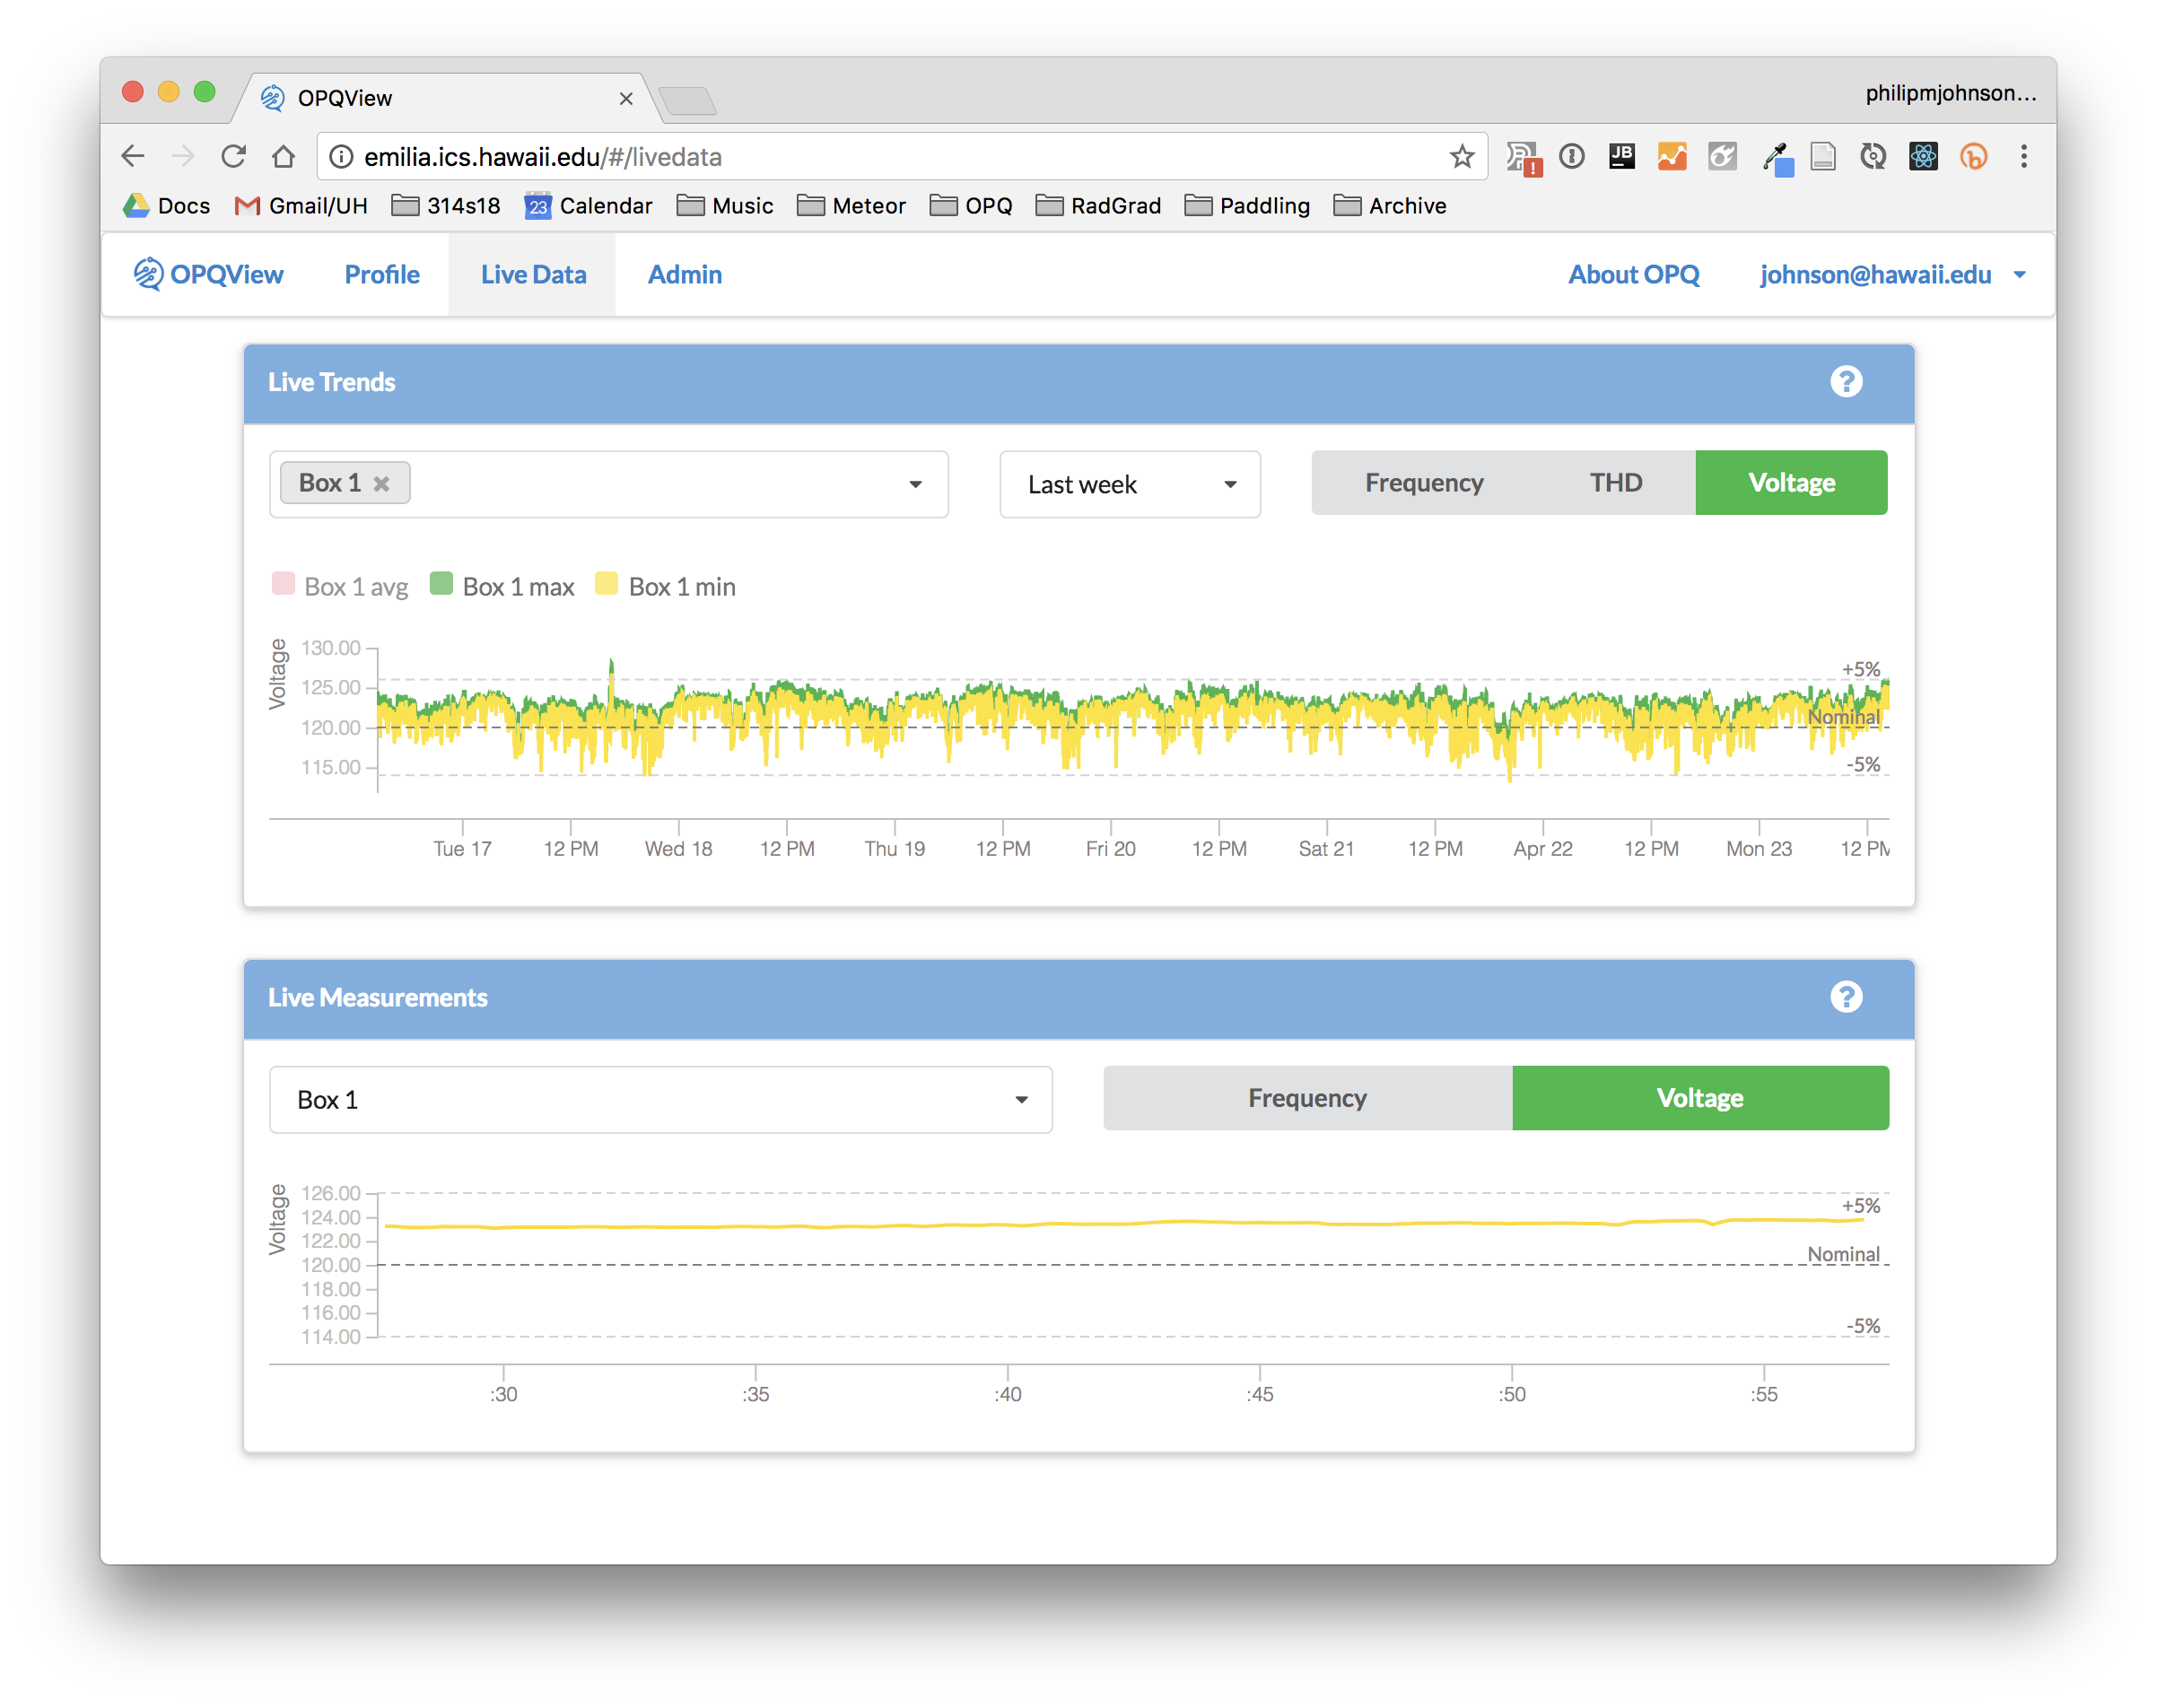
Live Data Page
The Live Data page enables the user to see power quality data sent from OPQ Boxes associated with the current user in real time.
You must be logged in to access this page.
Live Trends
Trends are entities that are generated once per minute with a summary of the maximum, minimum, and average frequency, voltage and THD for a given box during the prior minute.
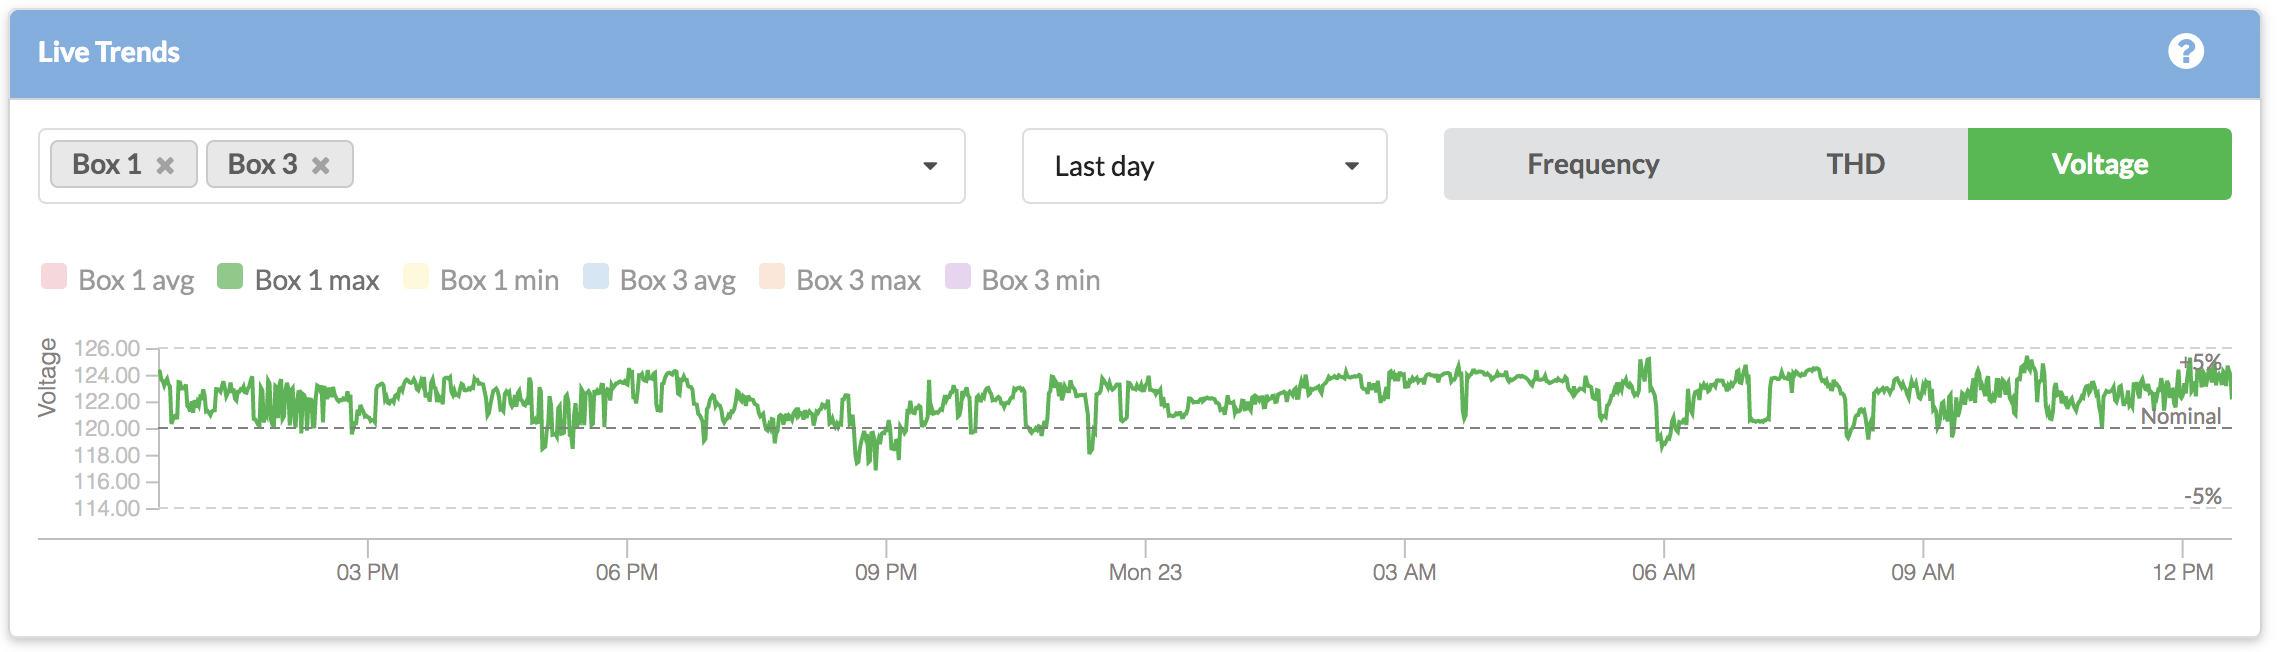
Live Trends enables the user to monitor this Trend data in real time. It will update automatically once per minute as Mauka generates new Trend data.
Boxes control: select one or more boxes whose values you wish to graph over time. Once you specify a box, you will be able to specify whether you want to see its maximum, minimum, and/or average values in its measurements.
Length control: Specify how much data you want to see.
Measurements control: select voltage, frequency, and/or THD.
This visualization supports panning and zooming. Scroll the mouse up or down over the visualization to change the time interval. Click and drag right or left to change the window of time displayed.
Live Measurements
Measurements are generated once a second by OPQ Boxes with instantaneous values for frequency, voltage, and THD.
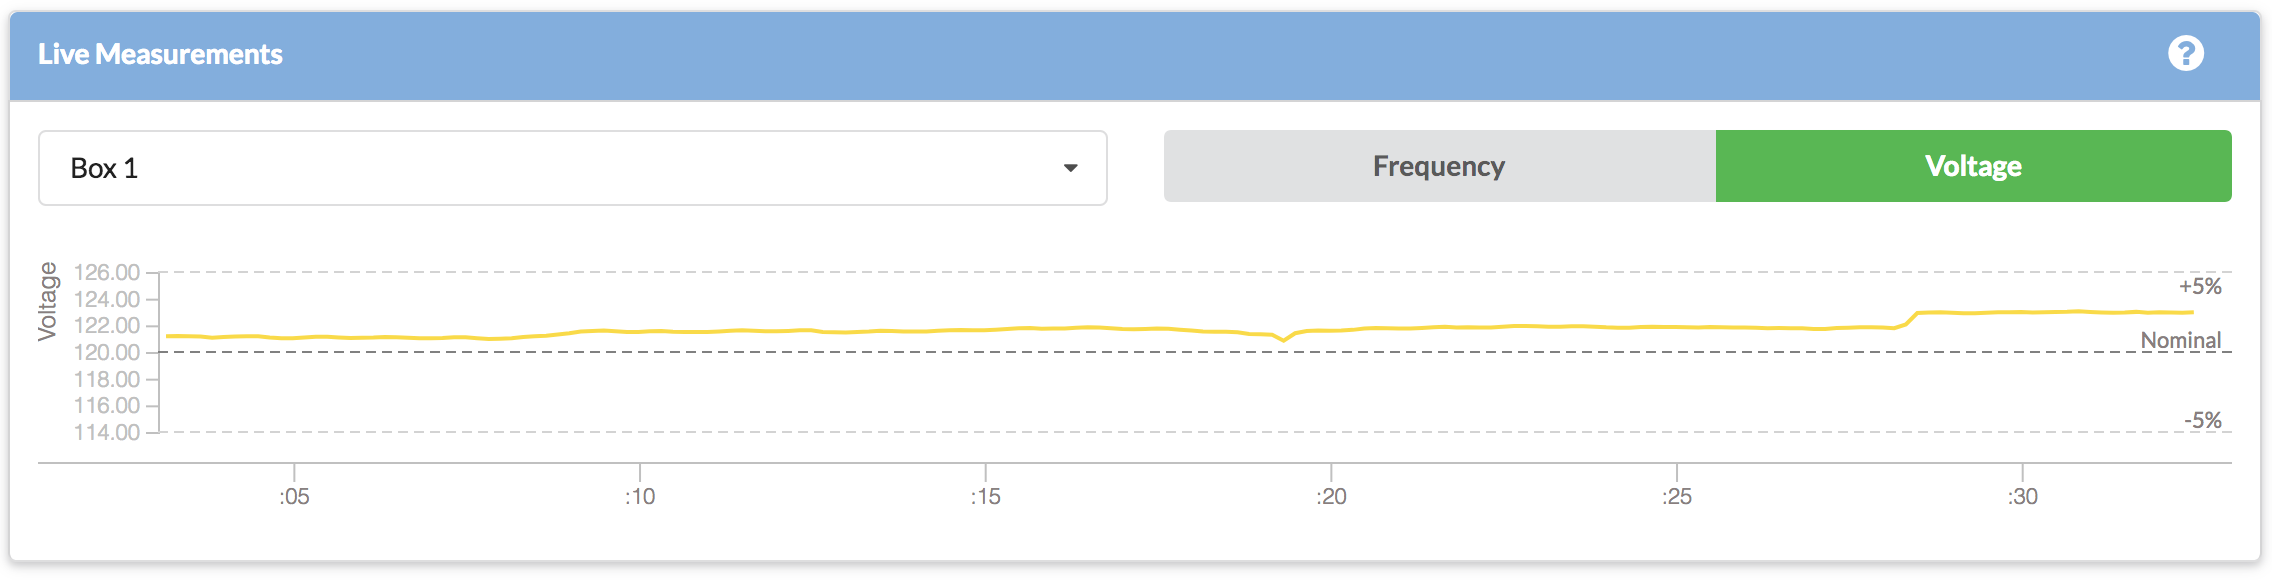
Live Measurements visualizes the last 30 seconds of live changes in frequency and/or voltage for one box. This is a data intensive visualization, so you can only monitor the data stream from one box at a time.
Boxes: select one box whose values you wish to graph over time.
Measurements: Click on voltage and/or frequency.
Event Inspector Page
The Event Inspector page enables the user to obtain details about Event data. You must be logged in to access this page.
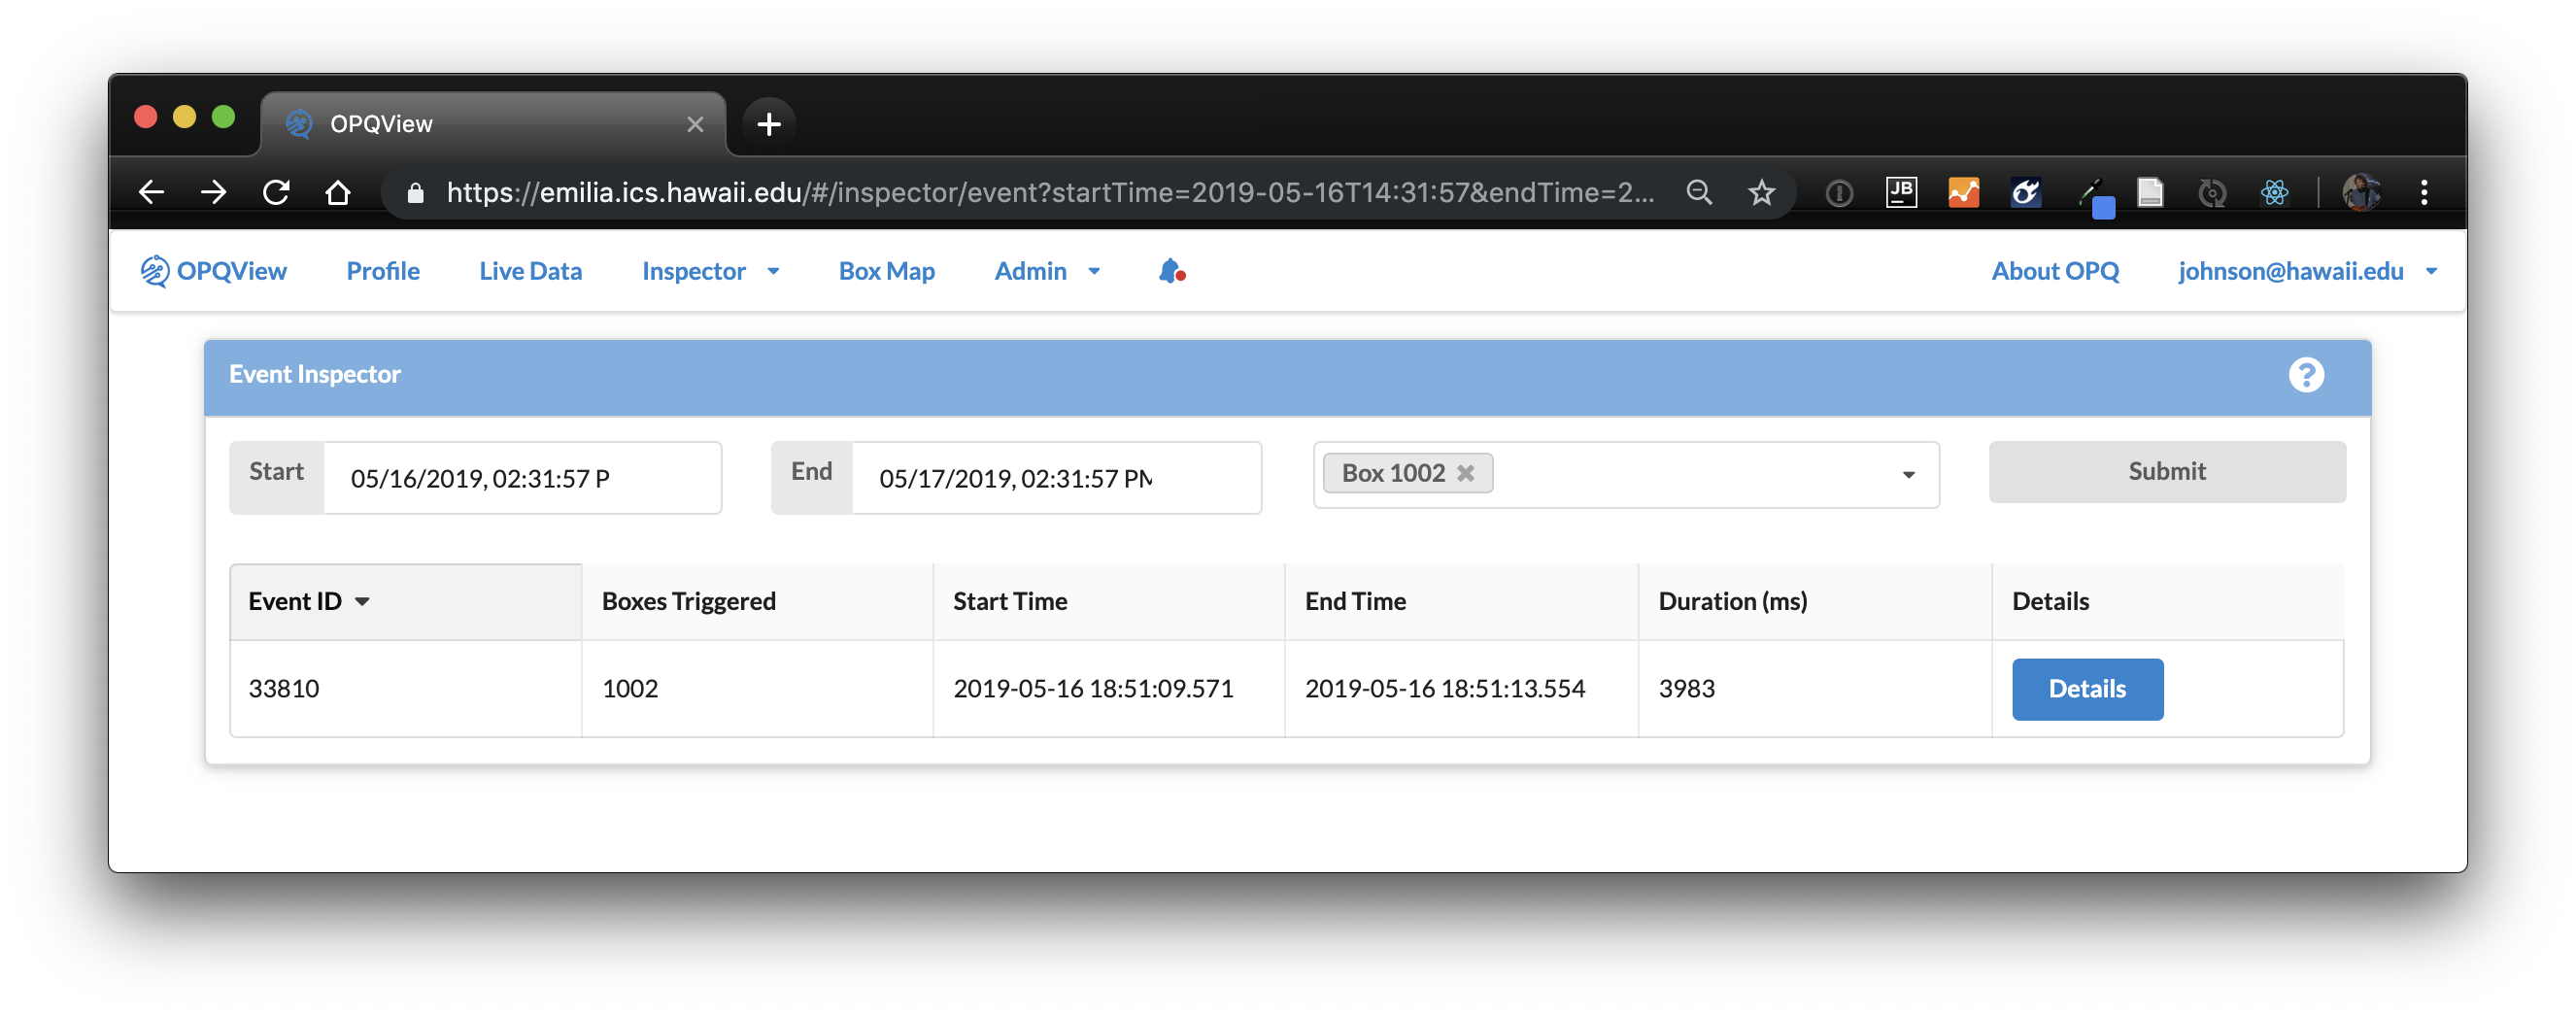
First, fill out the start and end date form fields, as well as a set of boxes, then press Submit to obtain a table of the Events that are available for that period of time.
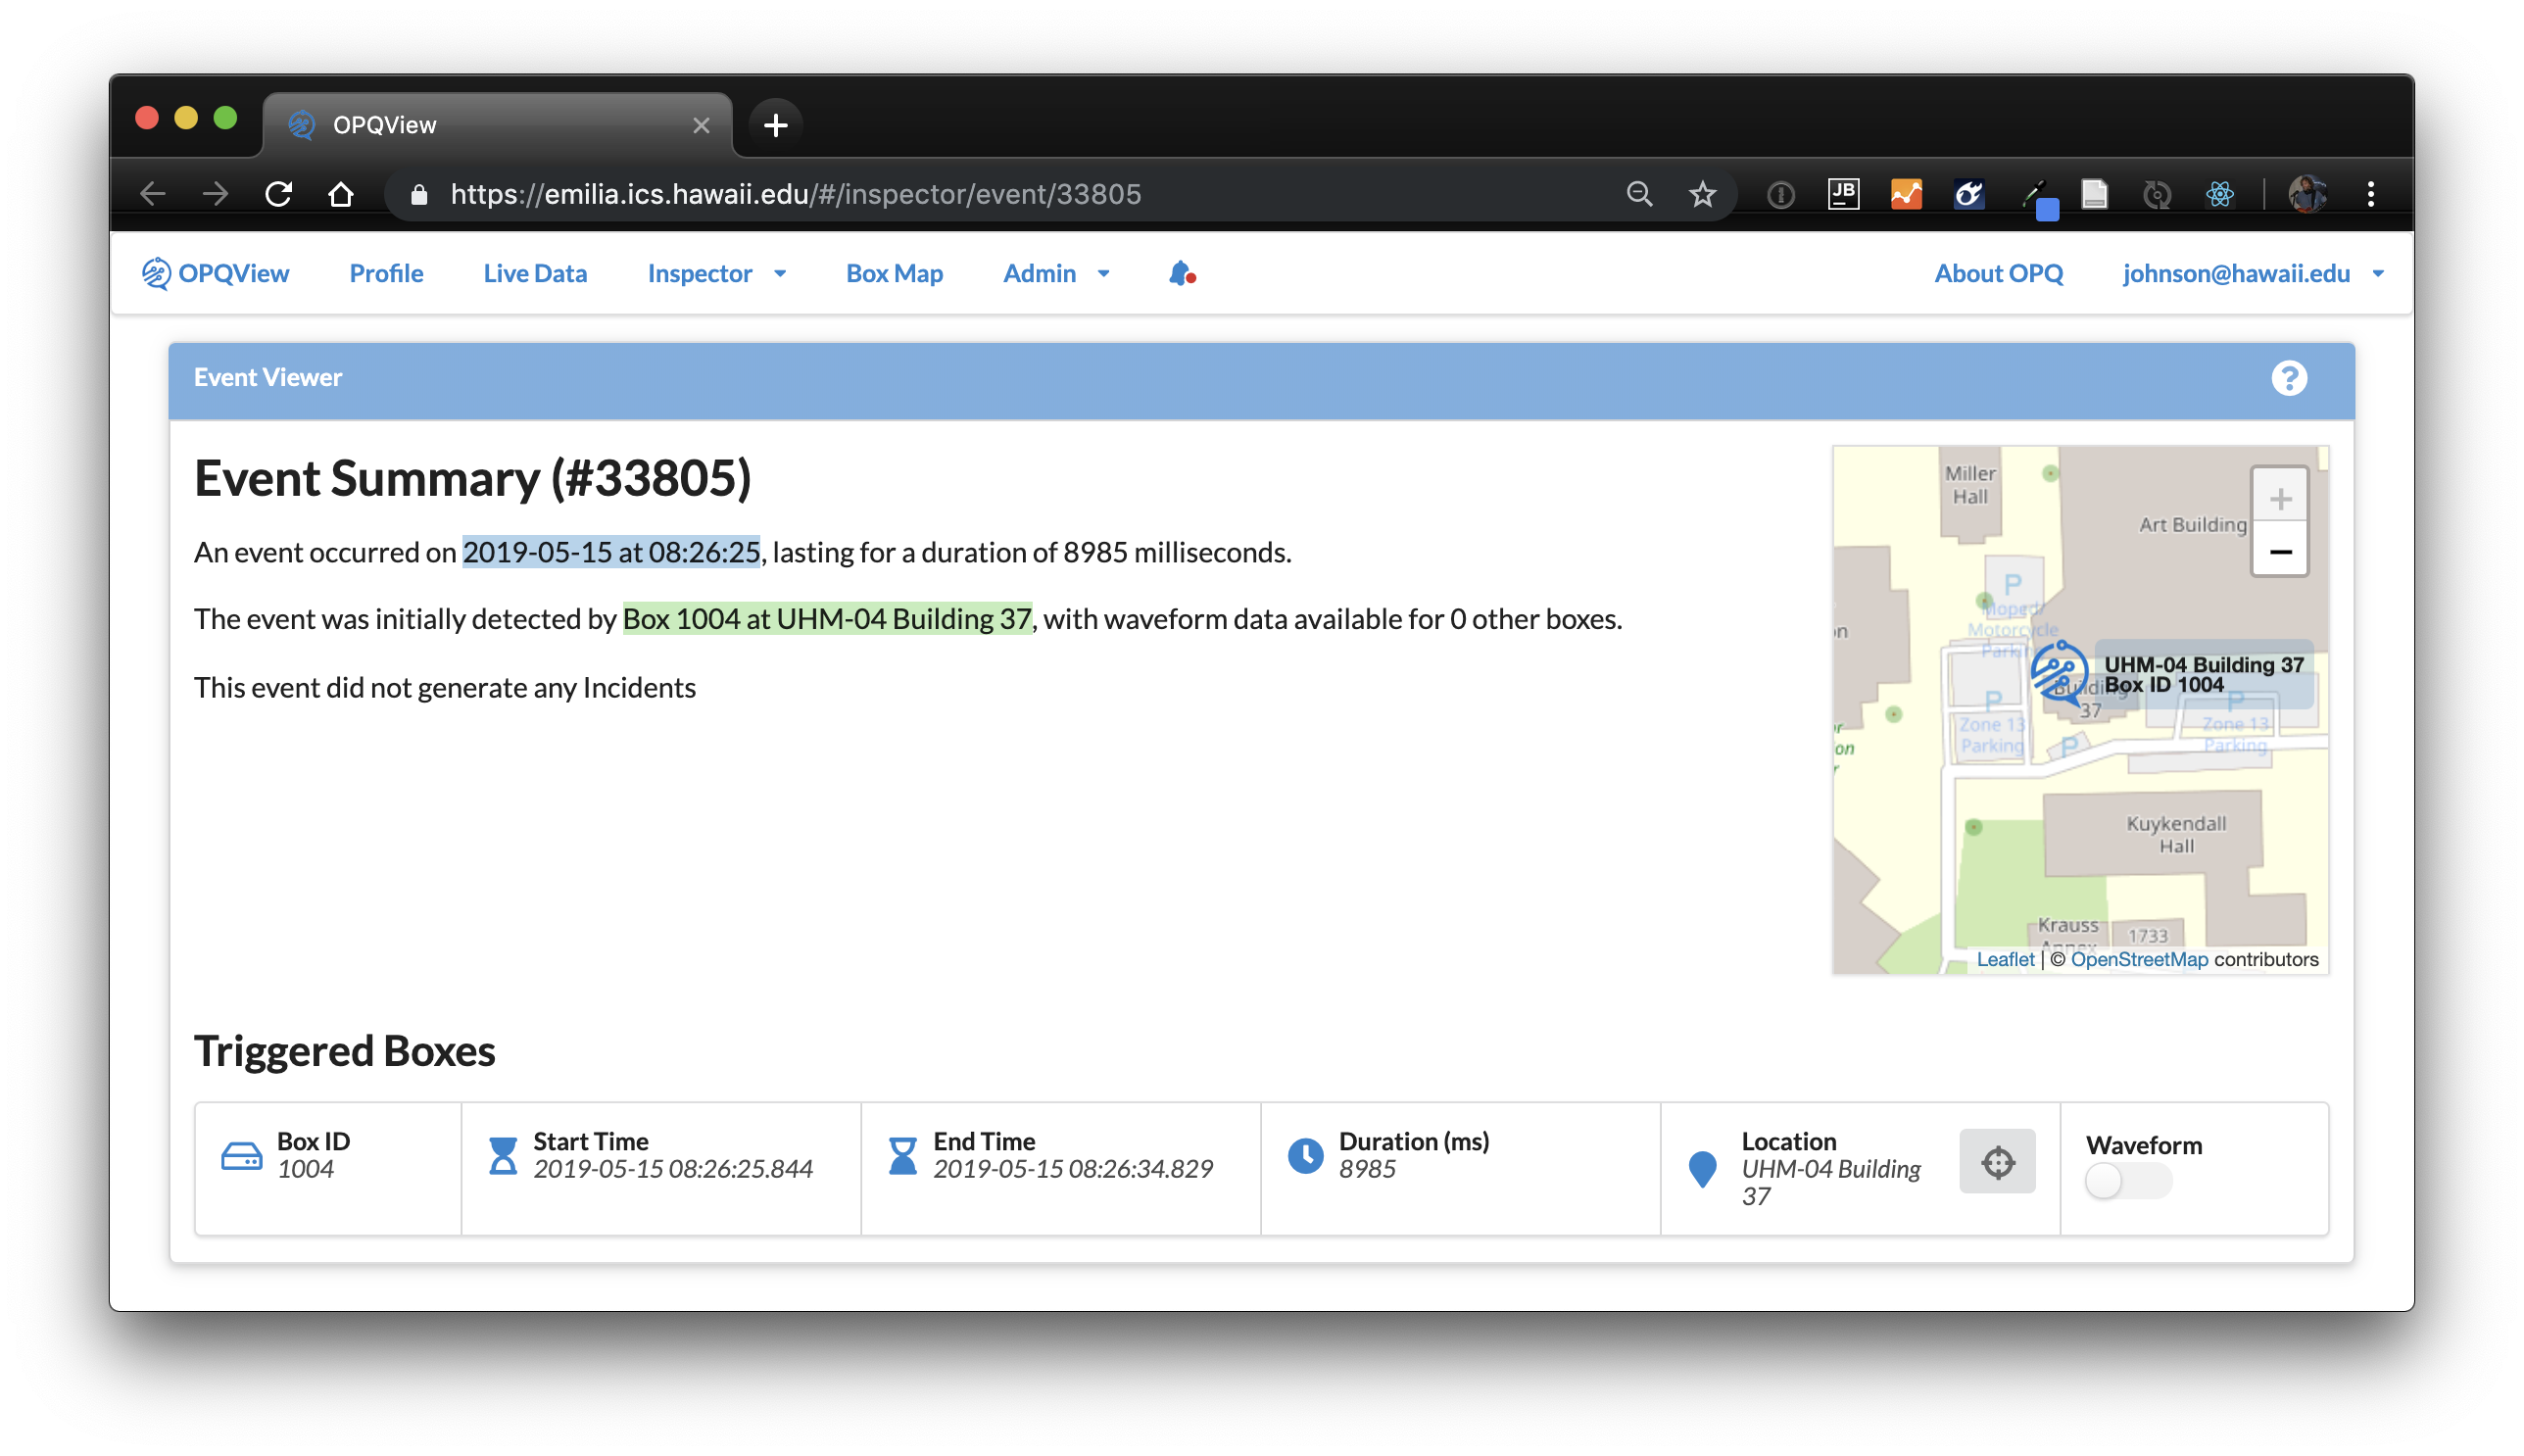
Event Details
For any Event, you can press the "Details" button to obtain more information:
Incident Inspector Page
The Incident Inspector page enables the user to obtain details about Incident data. You must be logged in to access this page.
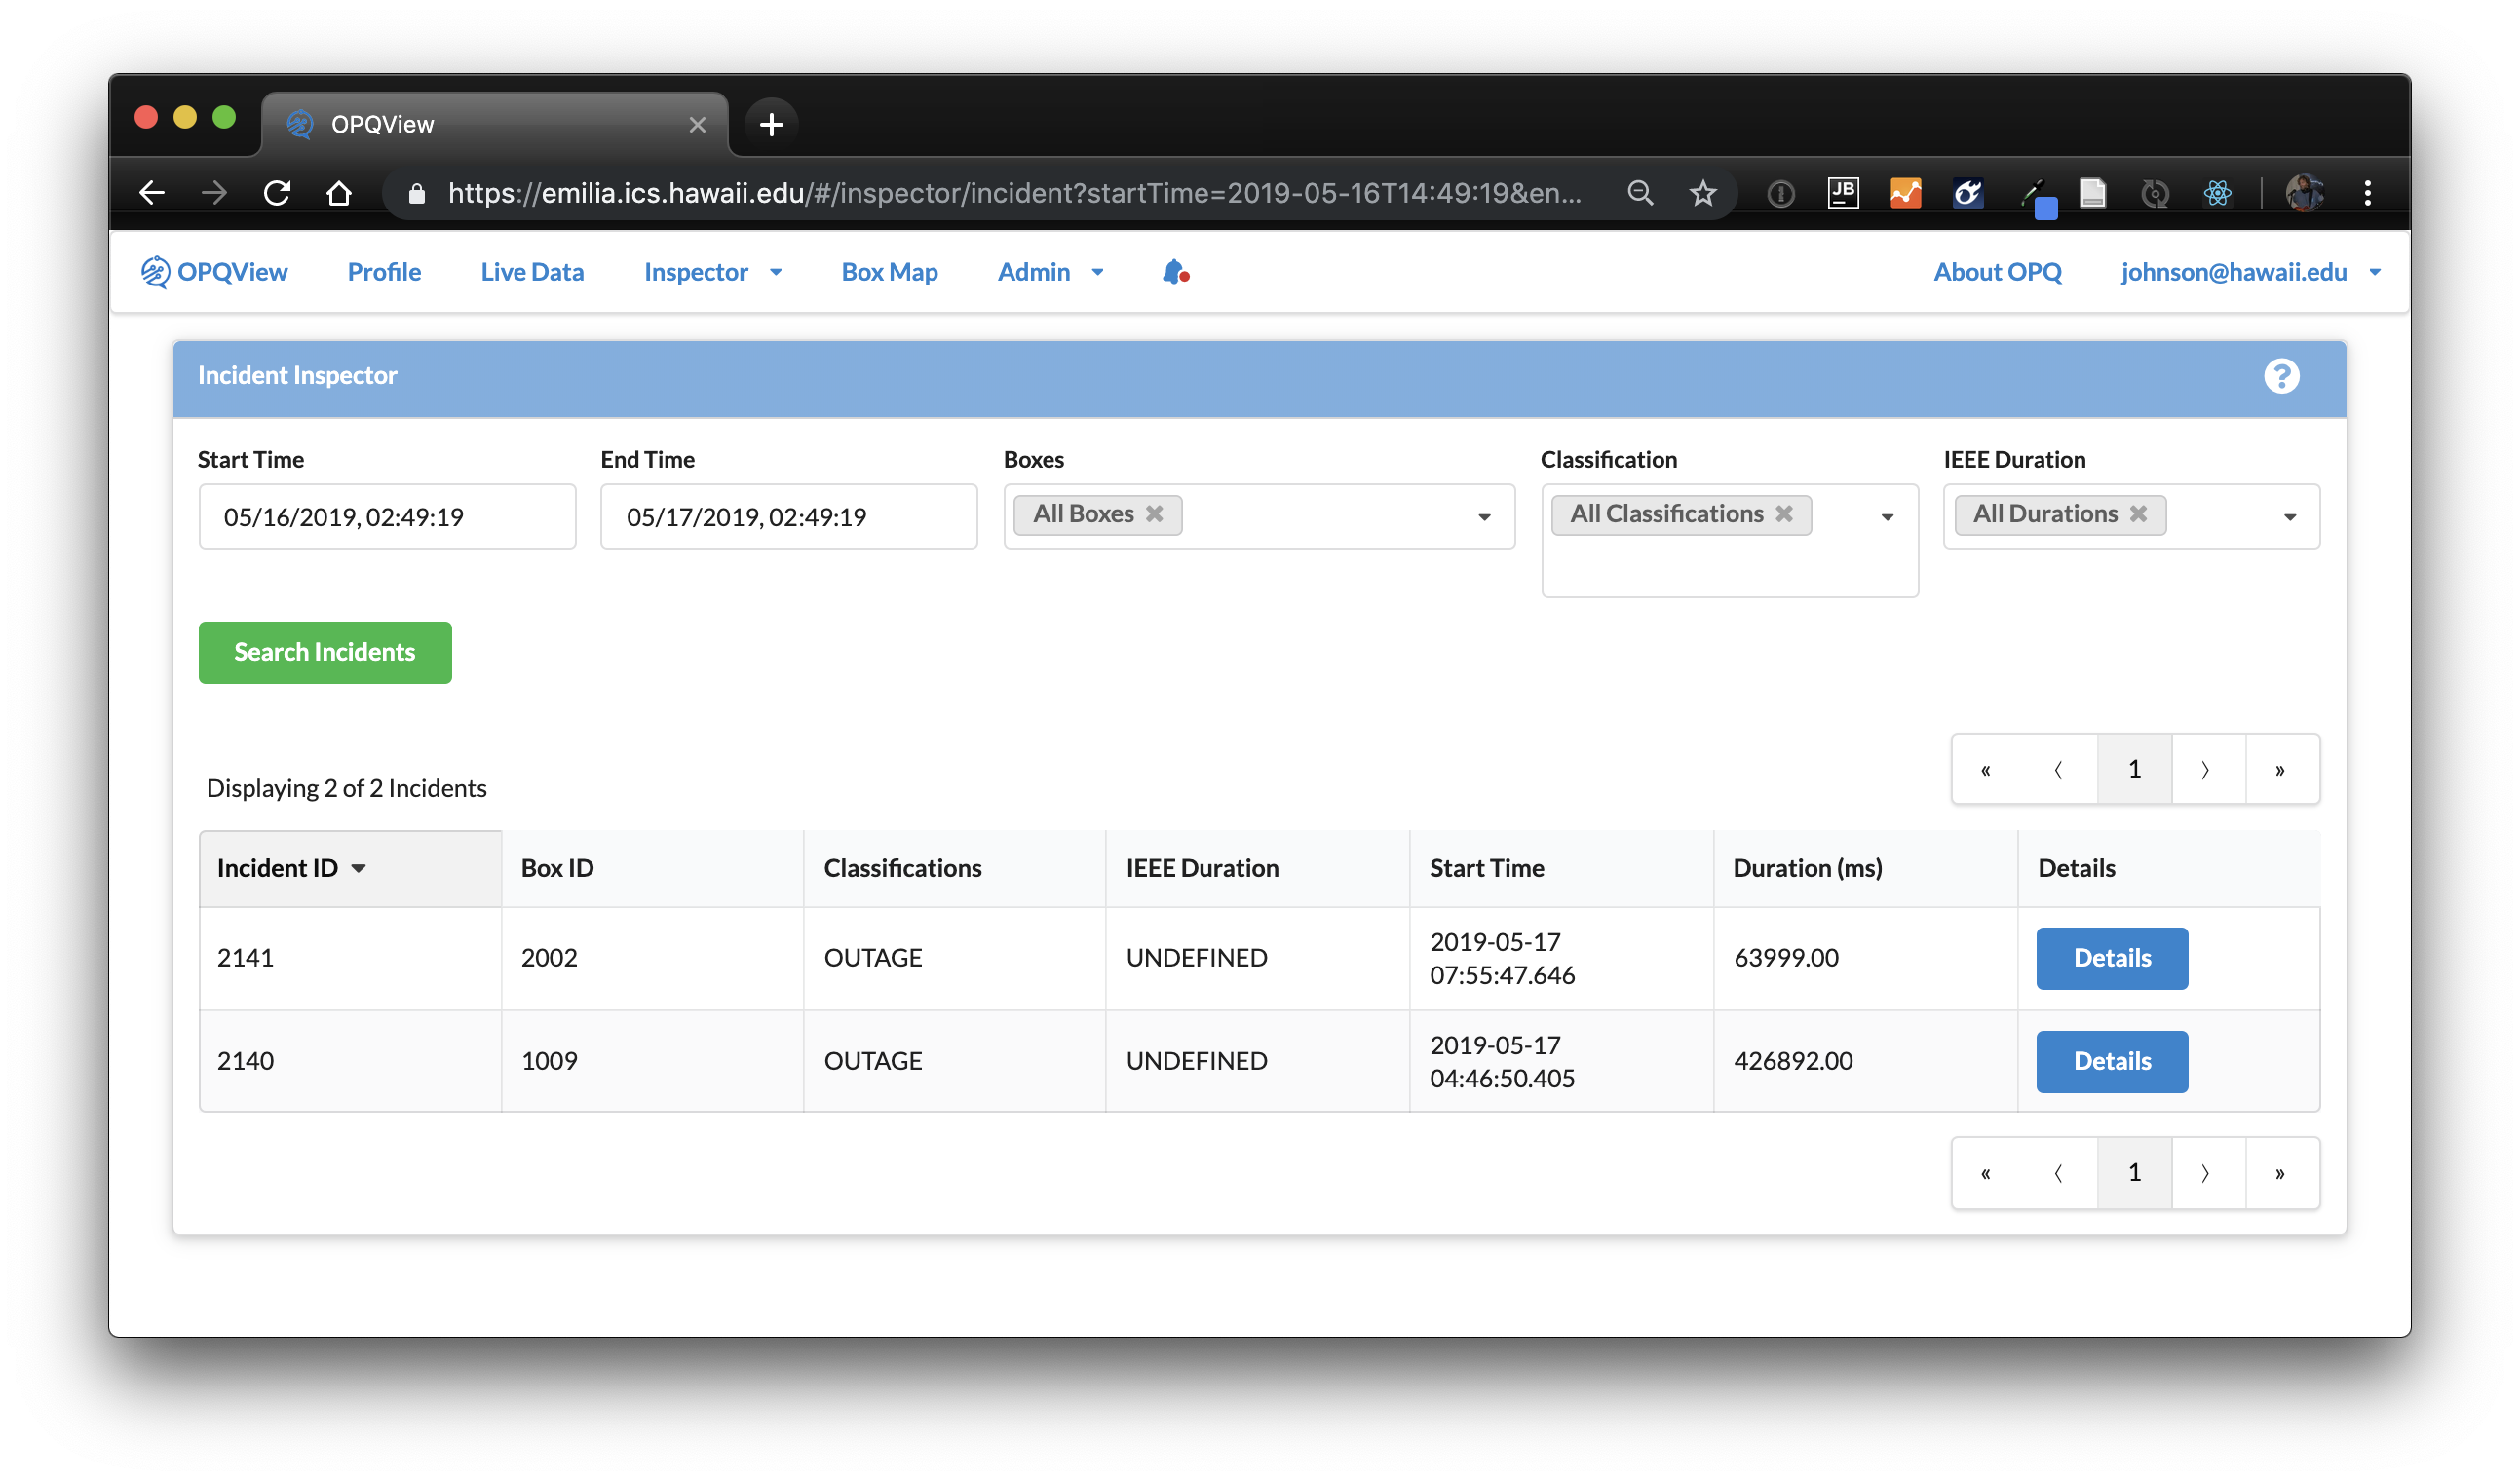
First, fill out the start and end date form fields, and the Boxes, Classifications, and Durations of interest, then click Submit to retrieve all corresponding Incidents.
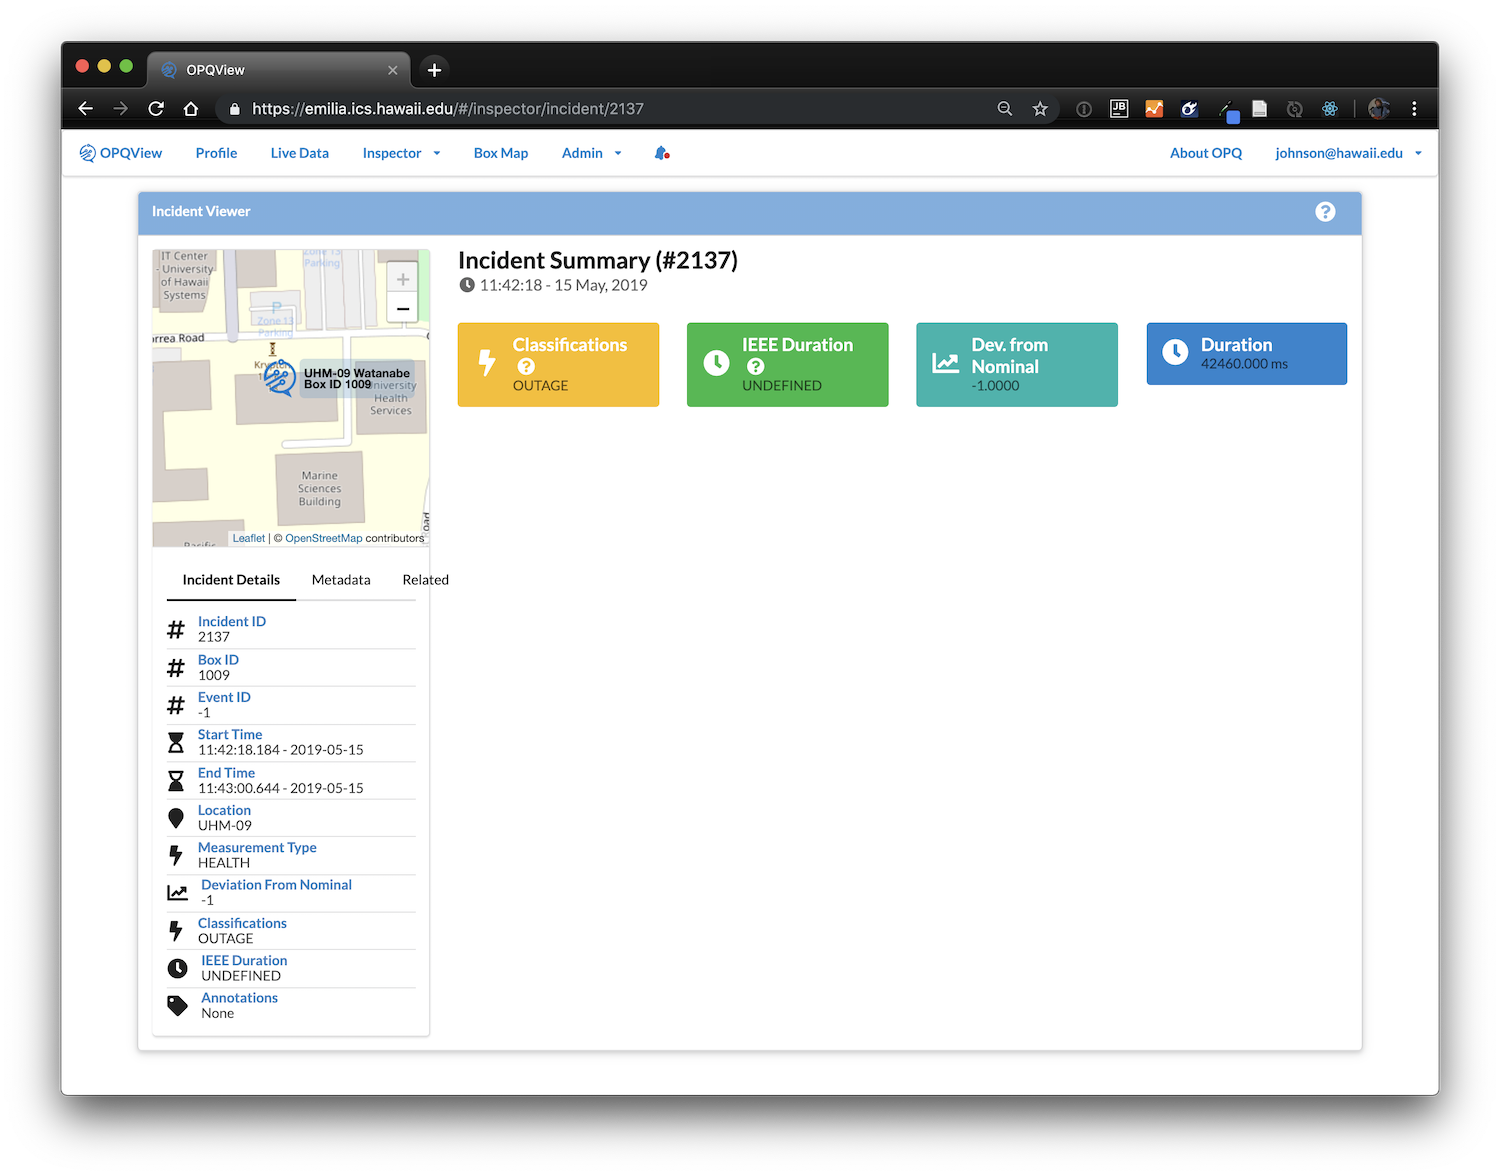
Incident Details
For any Incident, you can press the "Details" button to obtain more information:
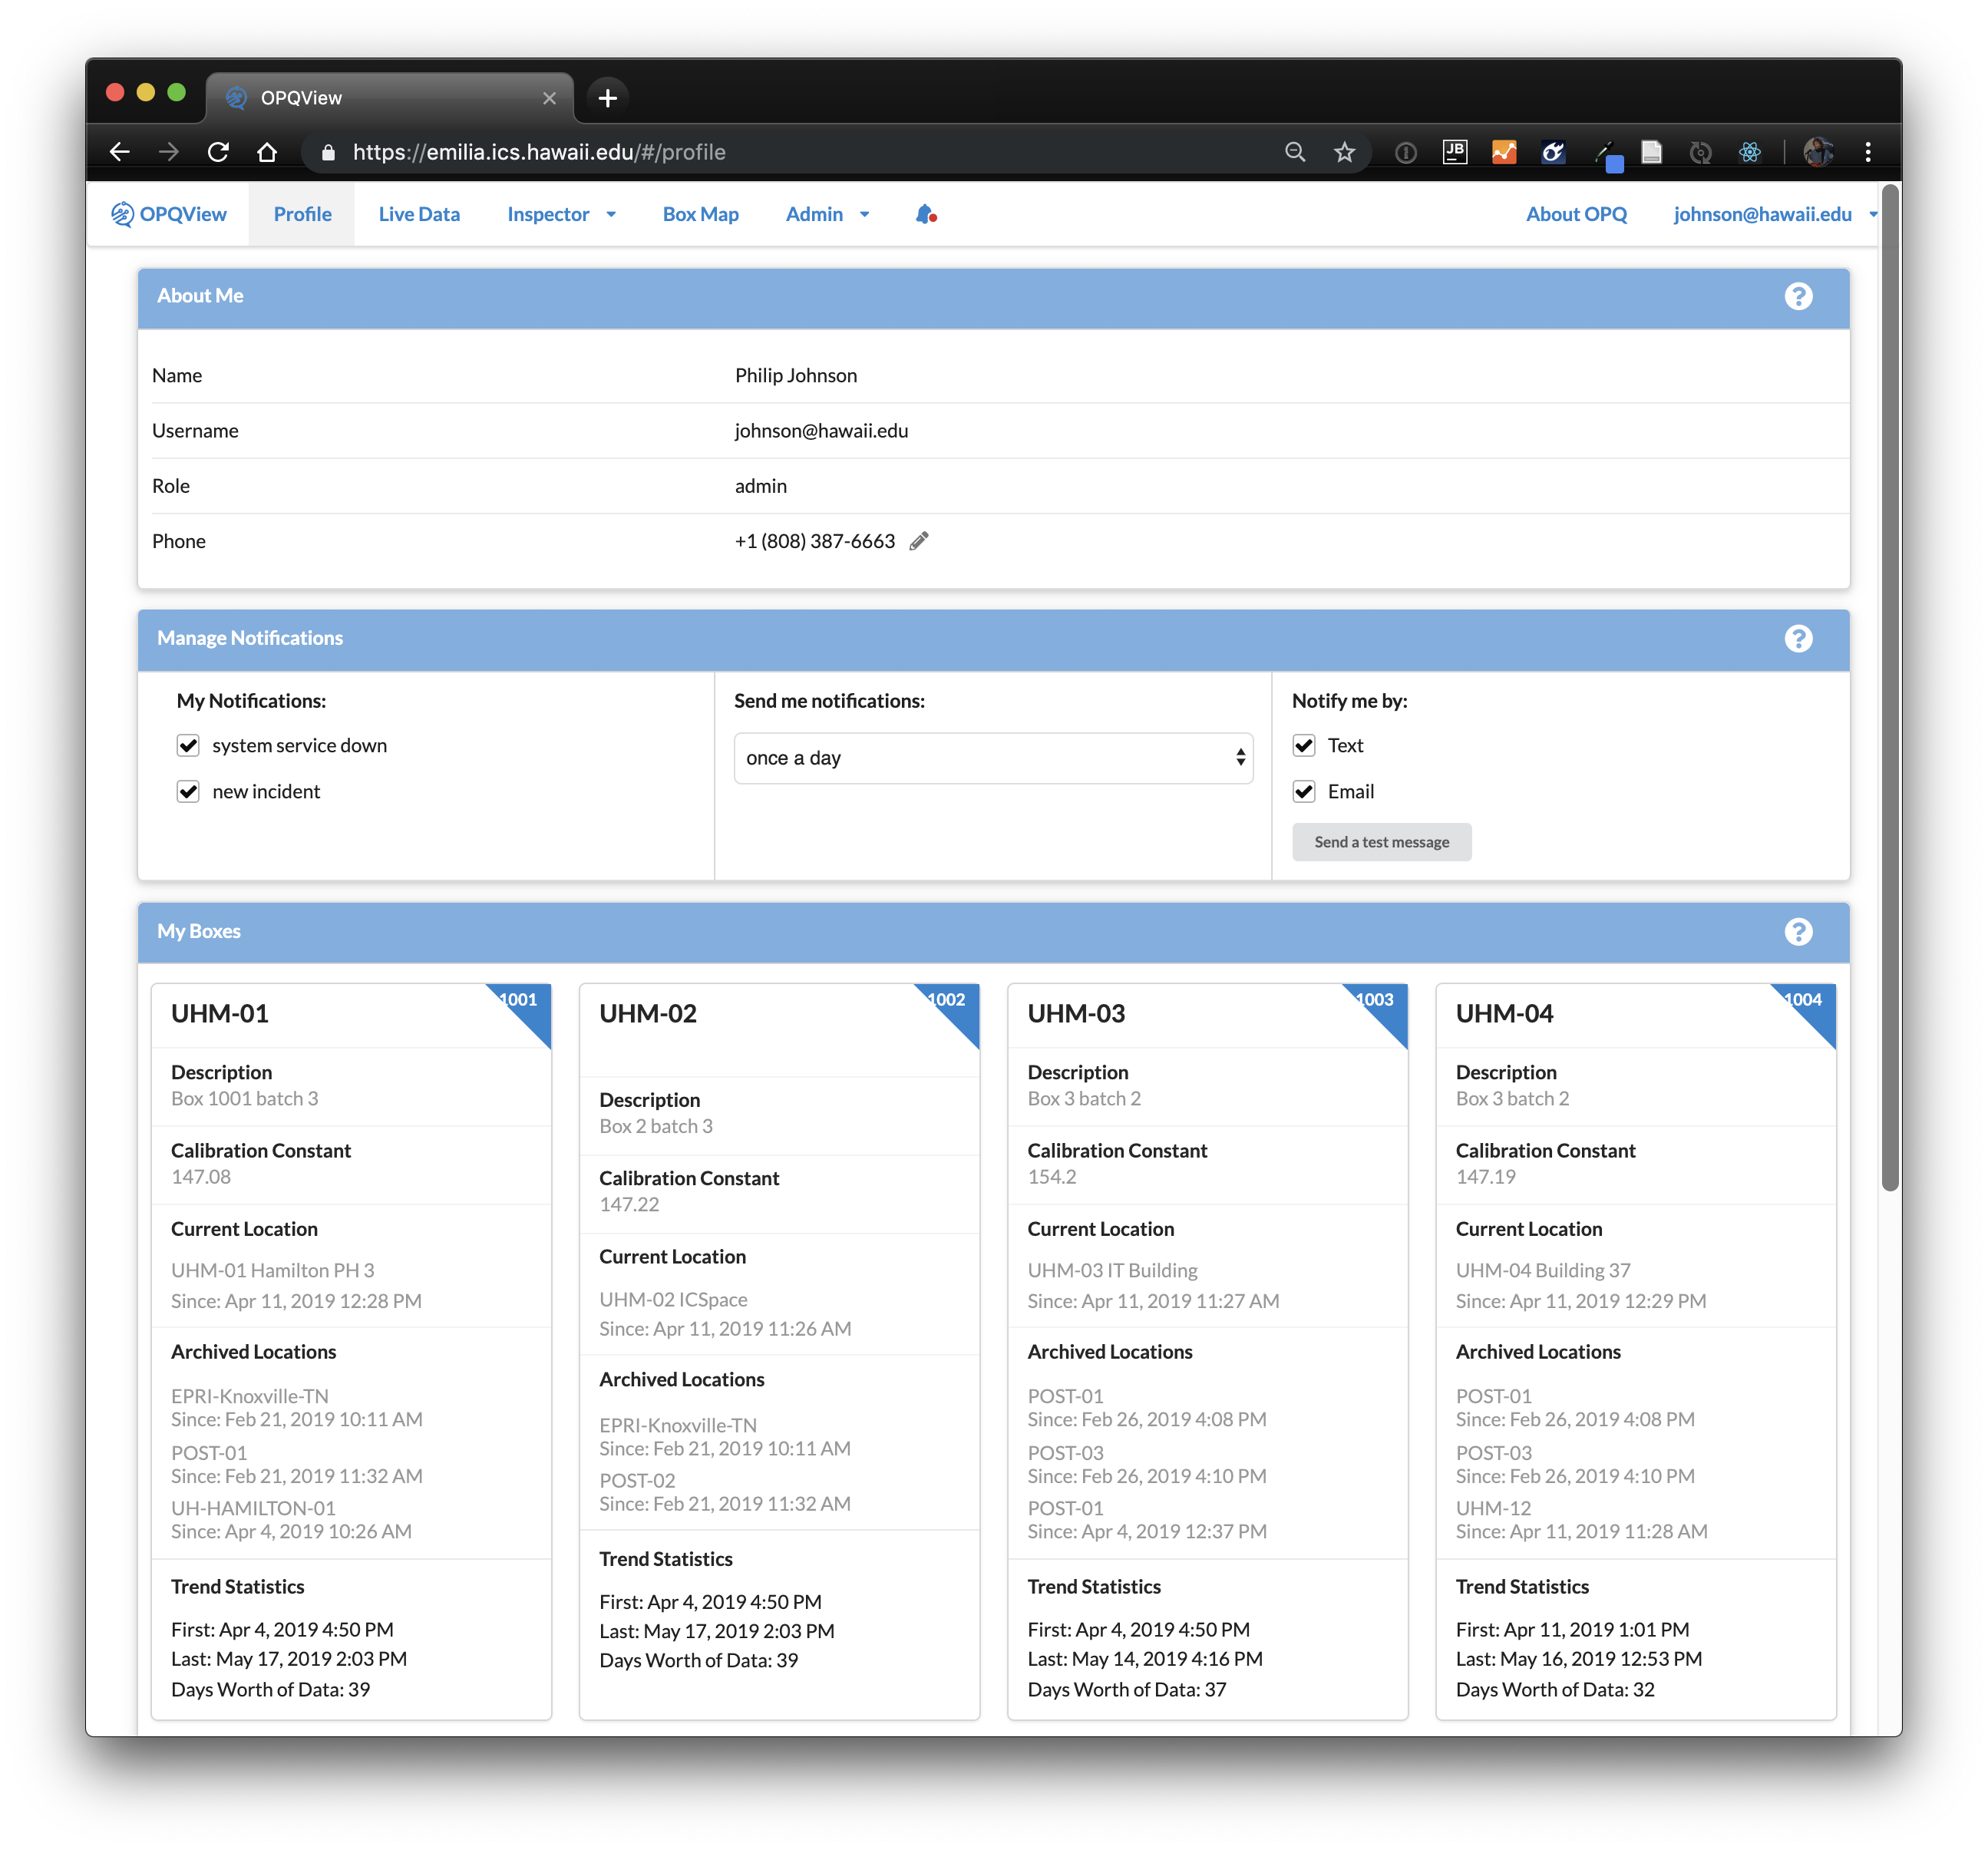
Profile Page
The profile page provides information about your account.
About Me
The About Me component provides summary information about the current logged in user.
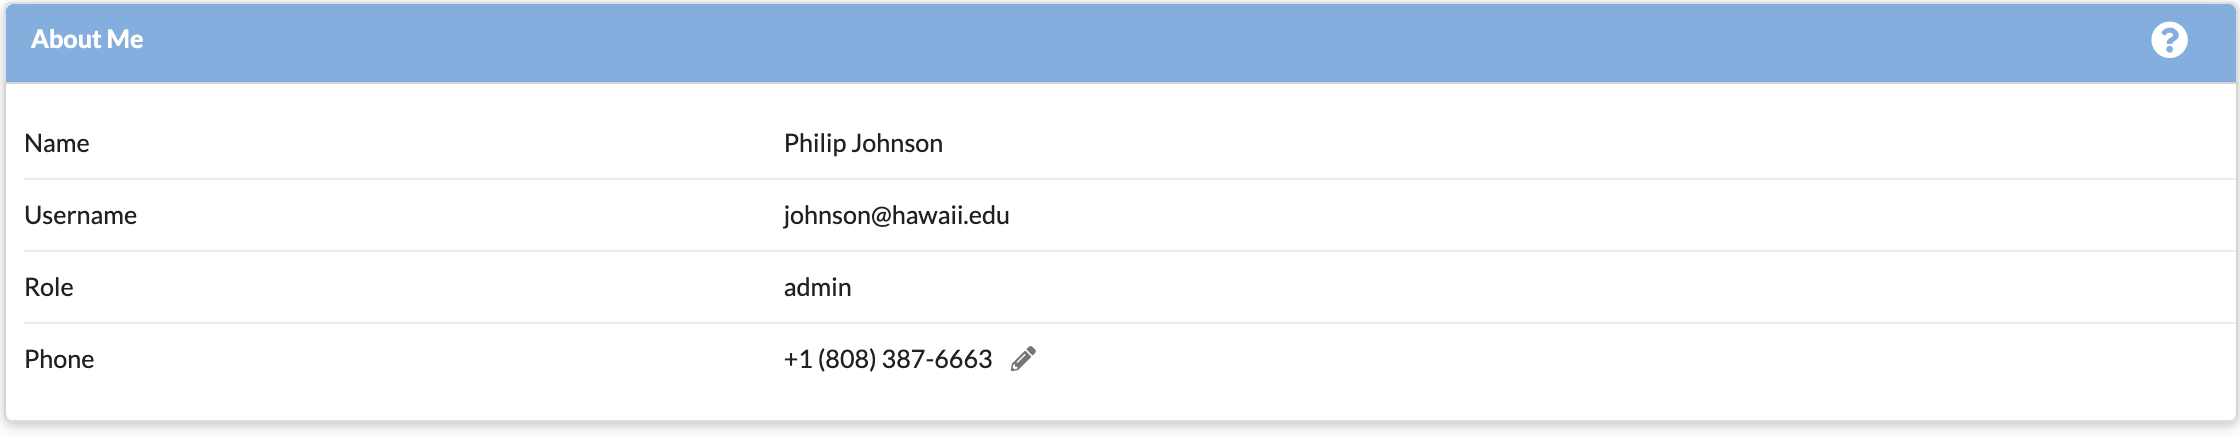
Only administrators can edit name and role information. The phone number field can be used if text message notification is available.
Manage Notifications
The Manage Notifications component enables the current user to request emails or text messages when things of interest occur in the system.
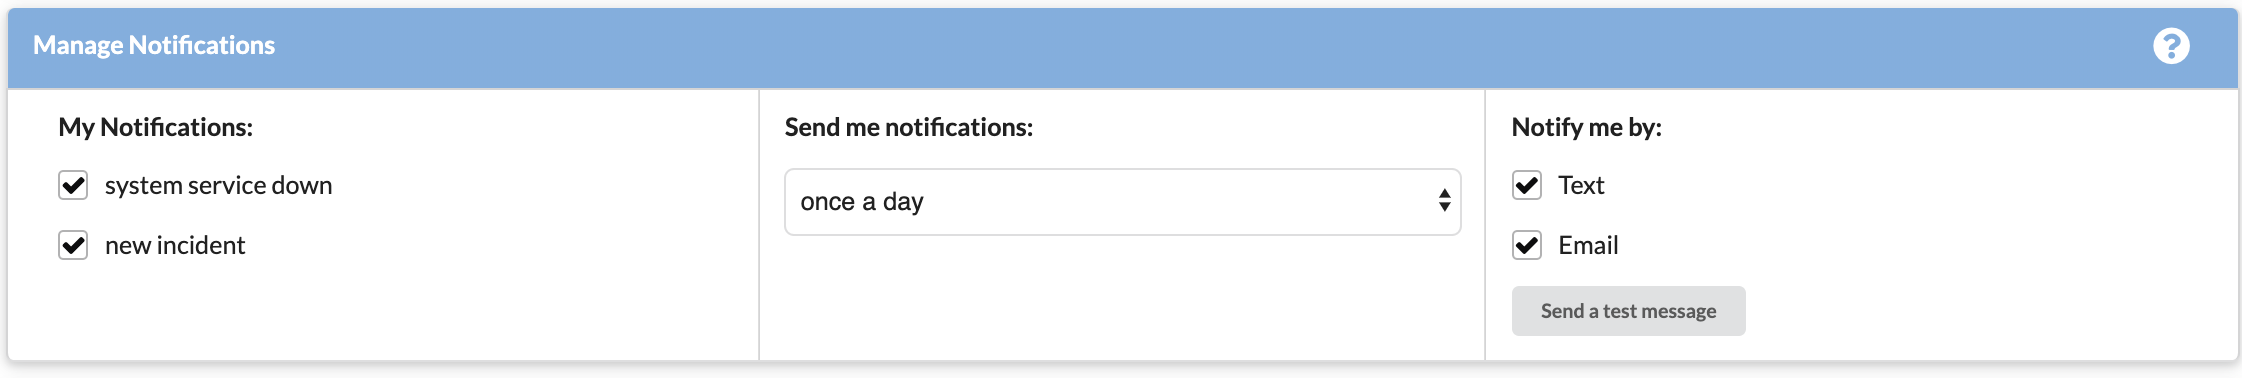
(Note: text messages are currently not operational.)
My boxes
The My Boxes component provides summary information about each OPQ Box owned by this user.
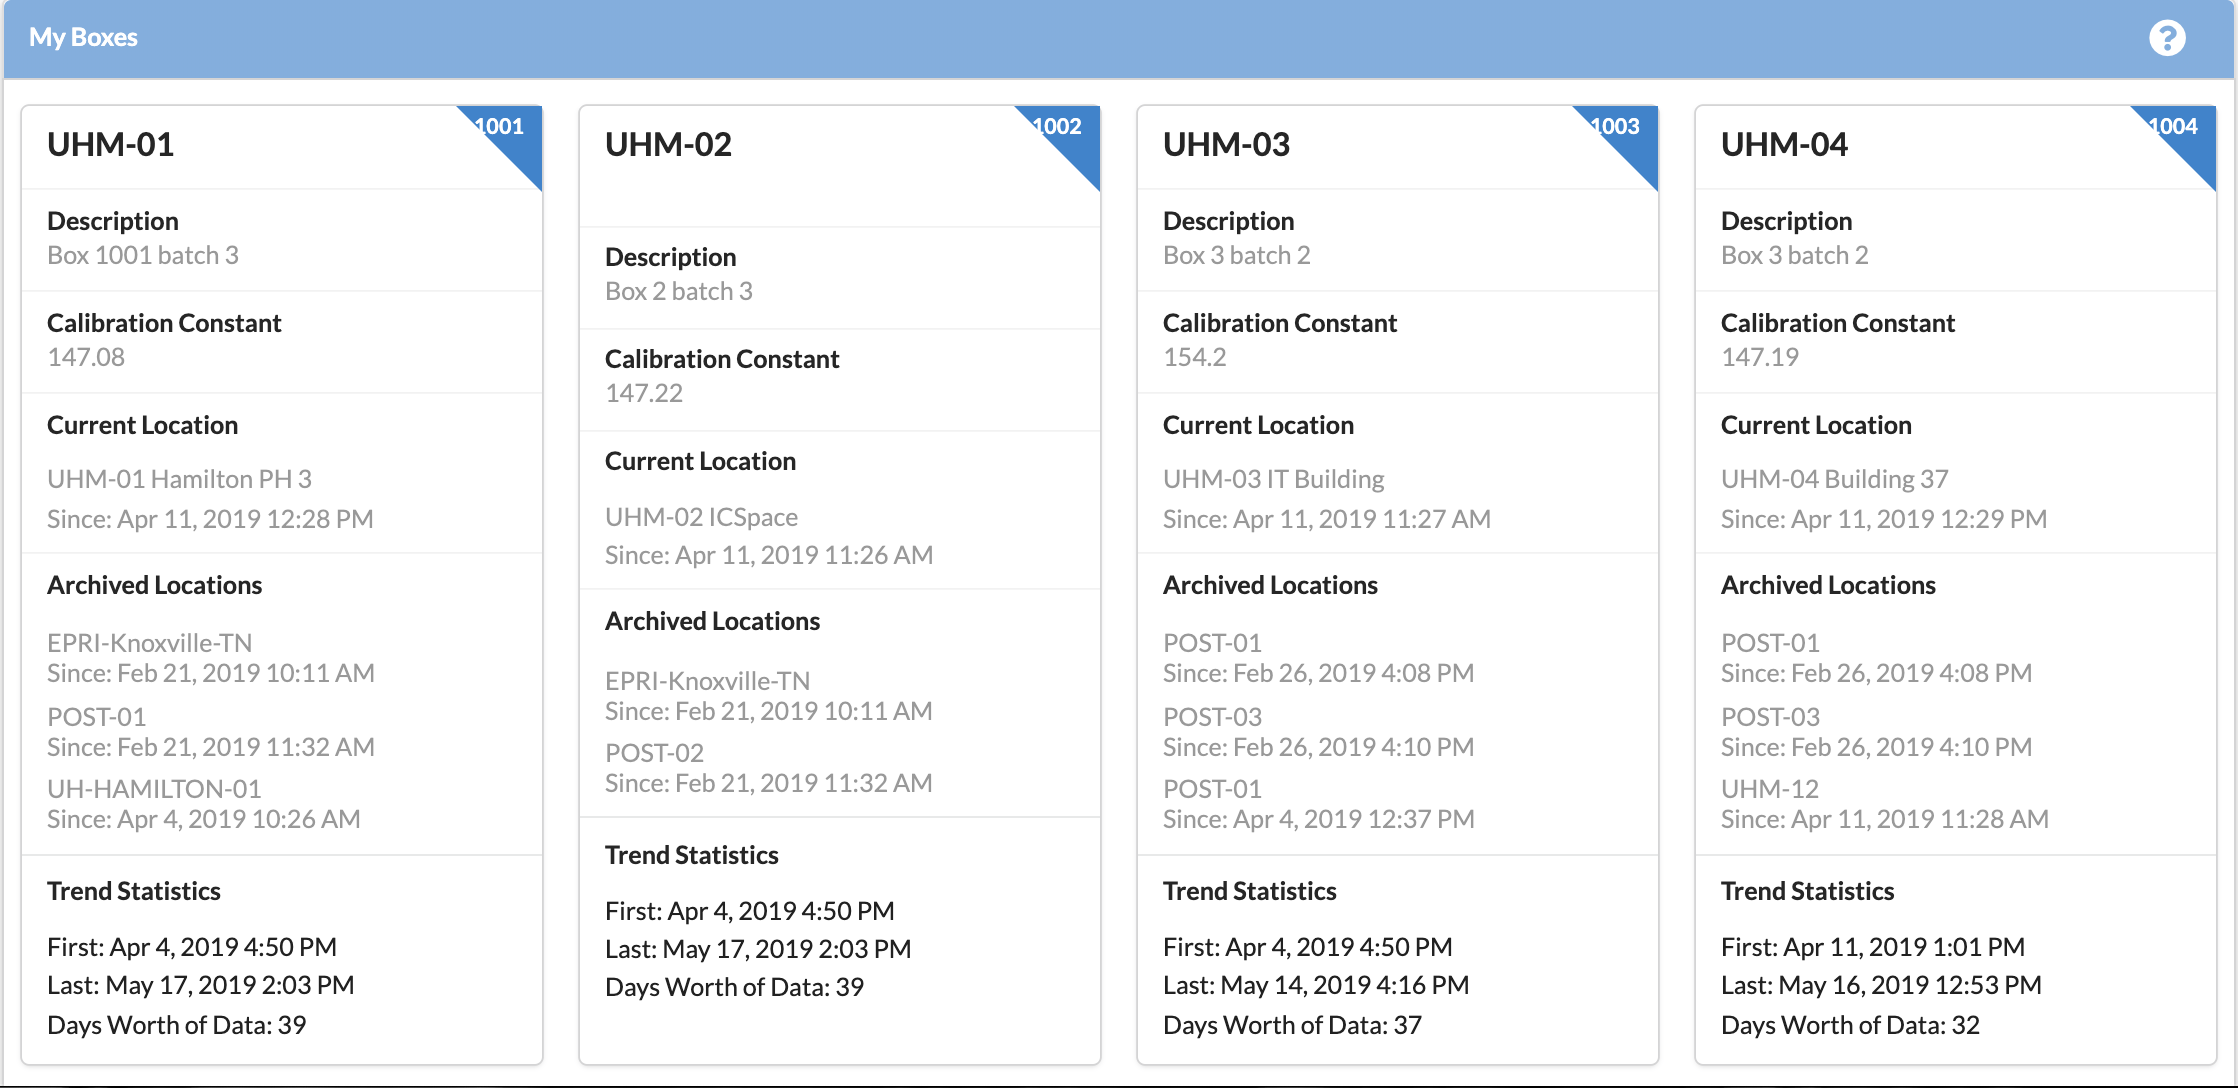
Note that it is possible for a single box to have more than one OPQ owner. It is also possible for an OPQBox to not have an owner.
Admin Pages
If your account has admin privileges, after logging in you will have access to an Admin drop-down menu that provides access to a number of additional pages.
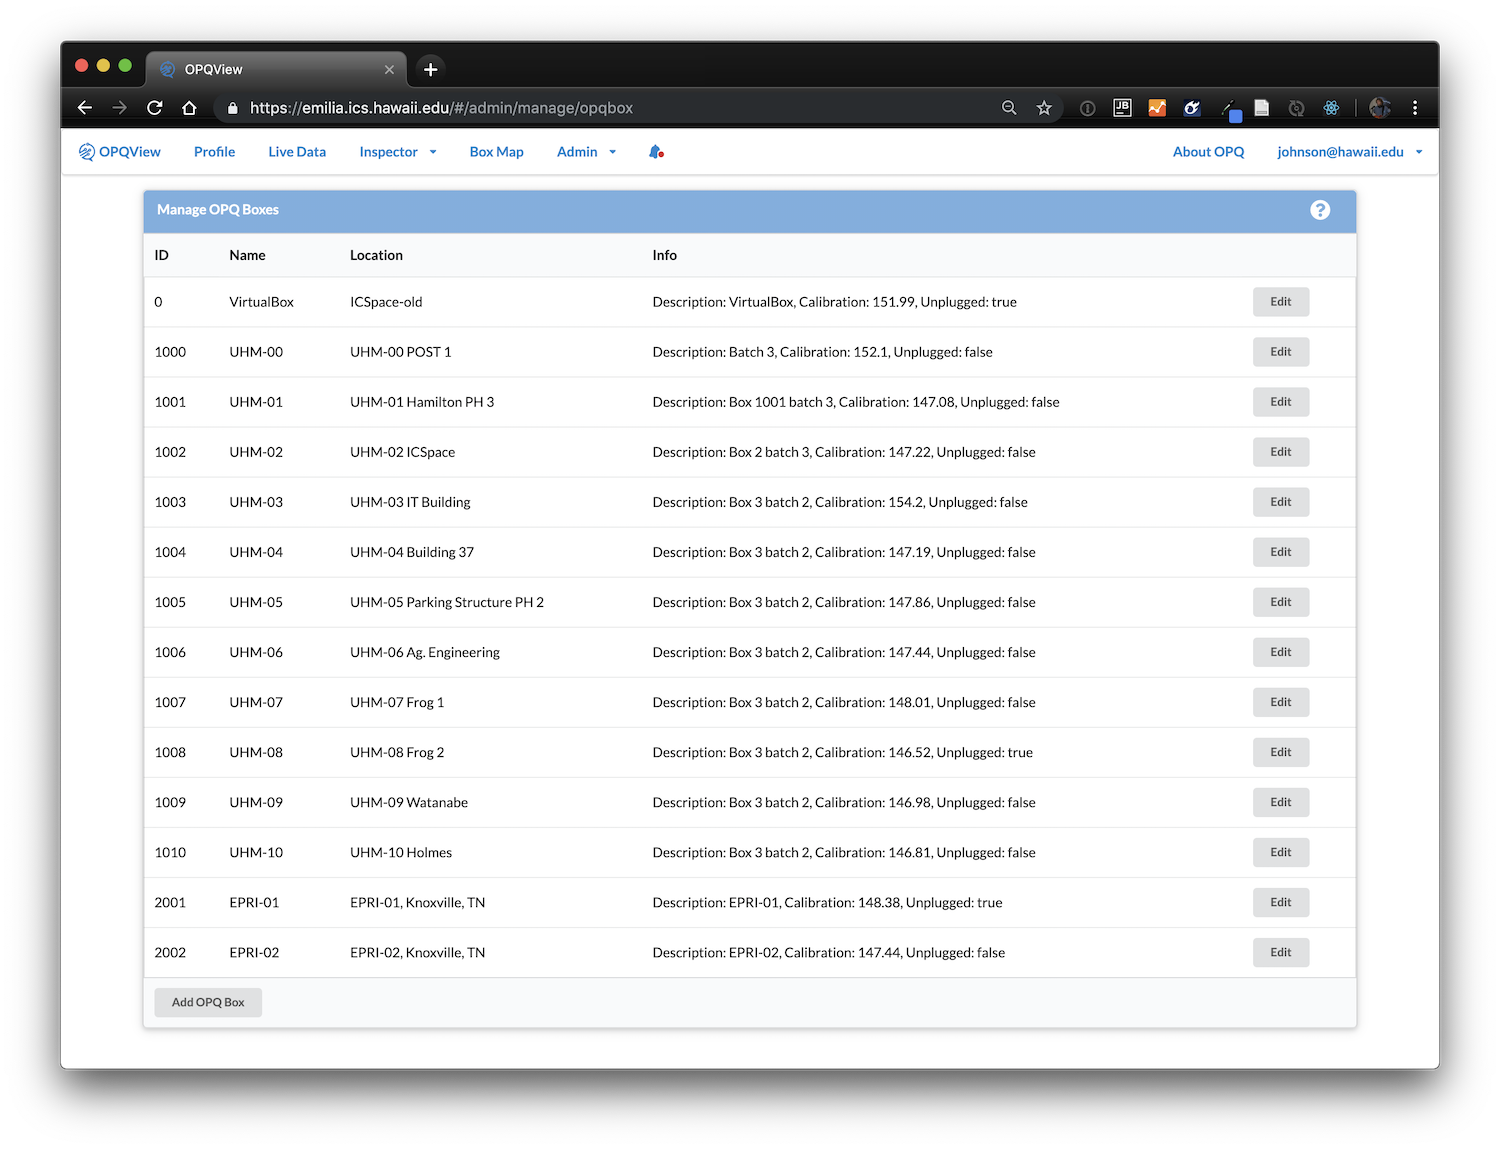
Manage Boxes
The Manage OPQ Boxes page allows the admin to add new Boxes to the system and edit the details associated with existing boxes:
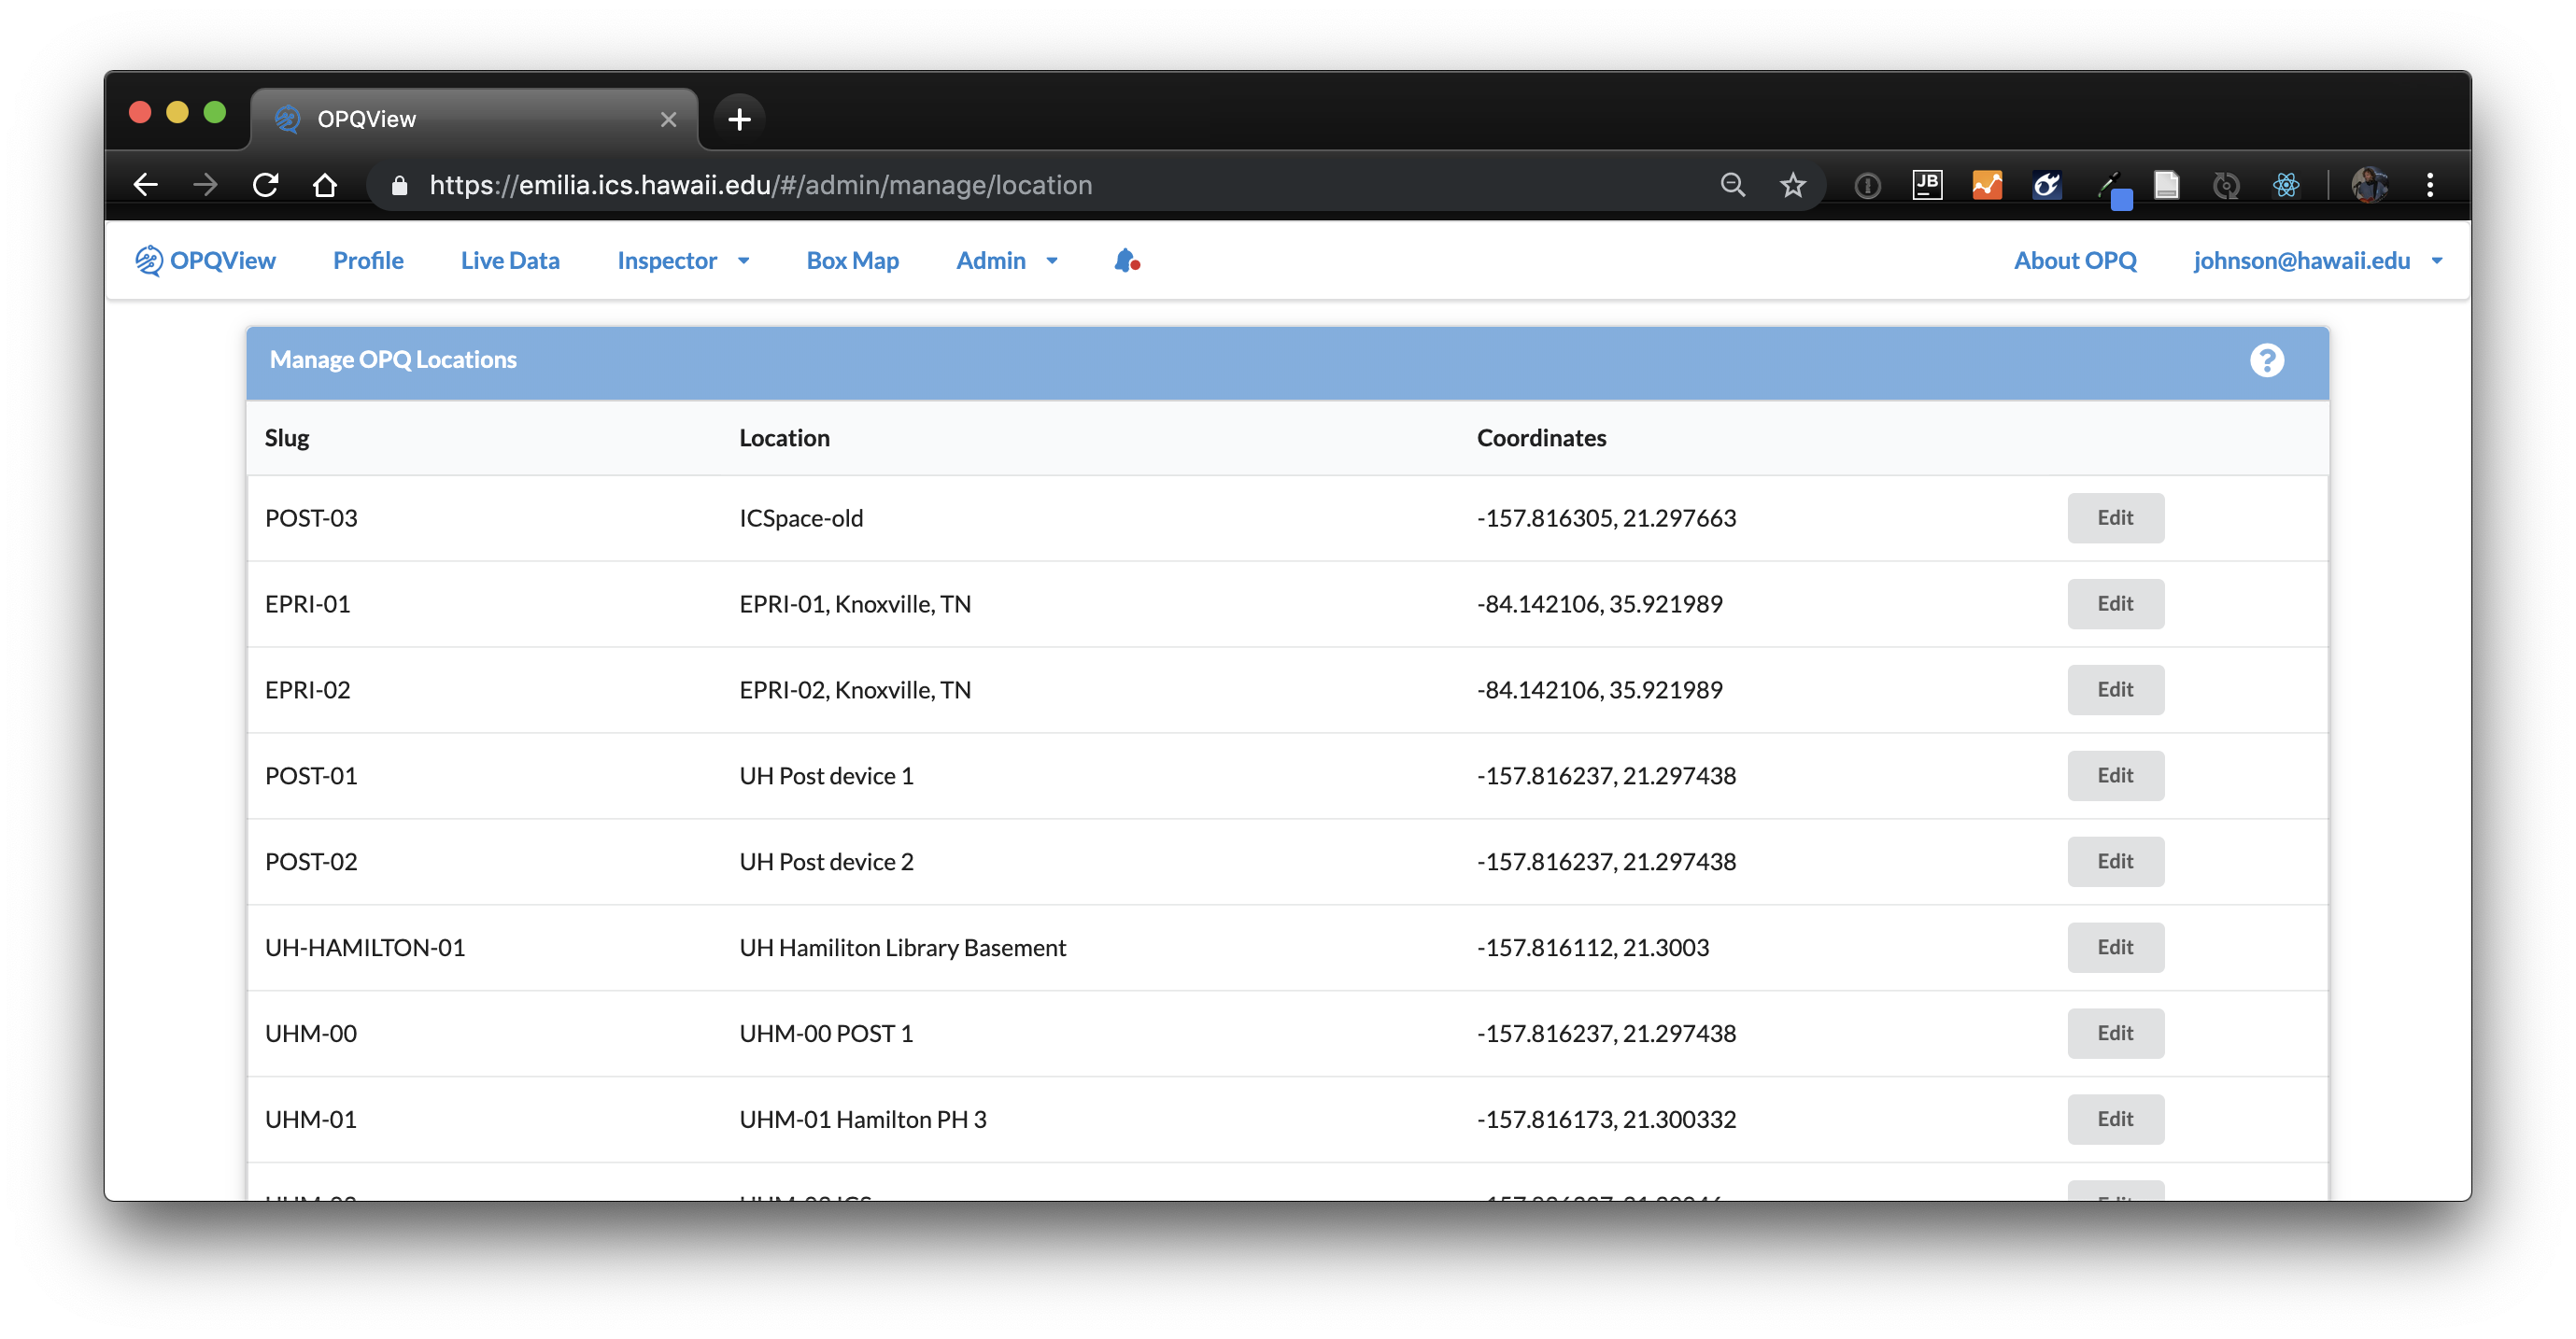
Manage Locations
The Manage OPQ Locations page allows the admin to add new Locations to the system and edit the details associated with existing locations:
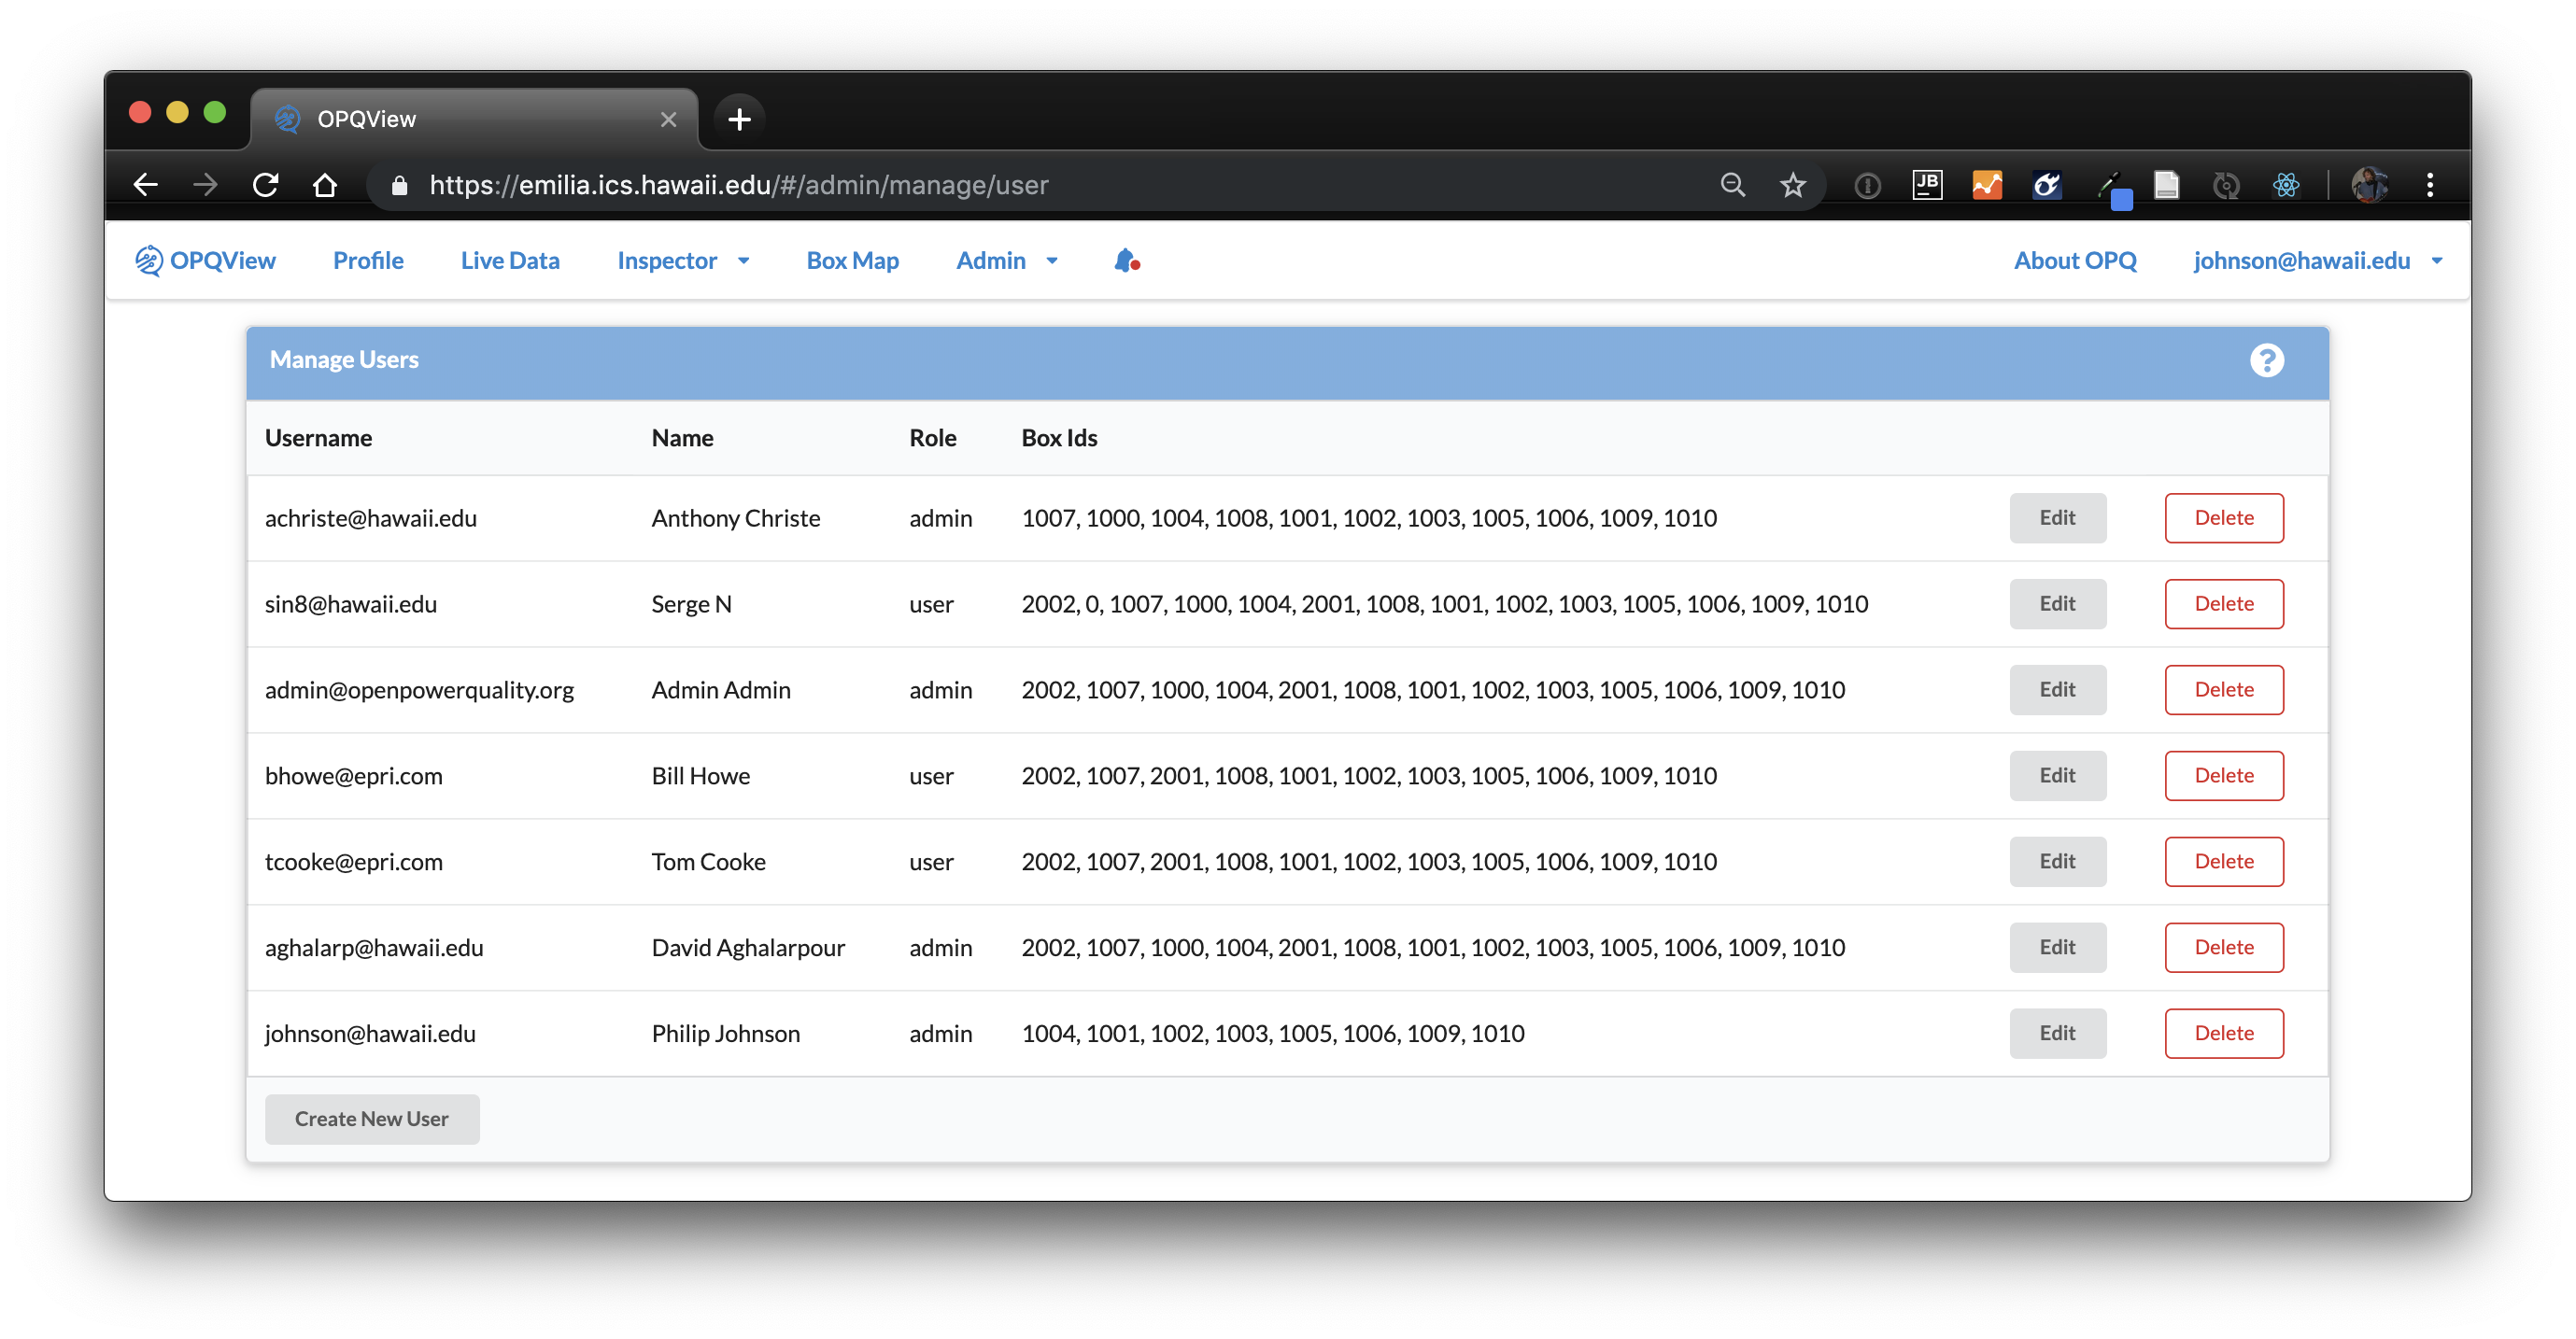
Manage Users
The Manage Users page allows the admin to add new Users to the system and edit the details associated with existing users:
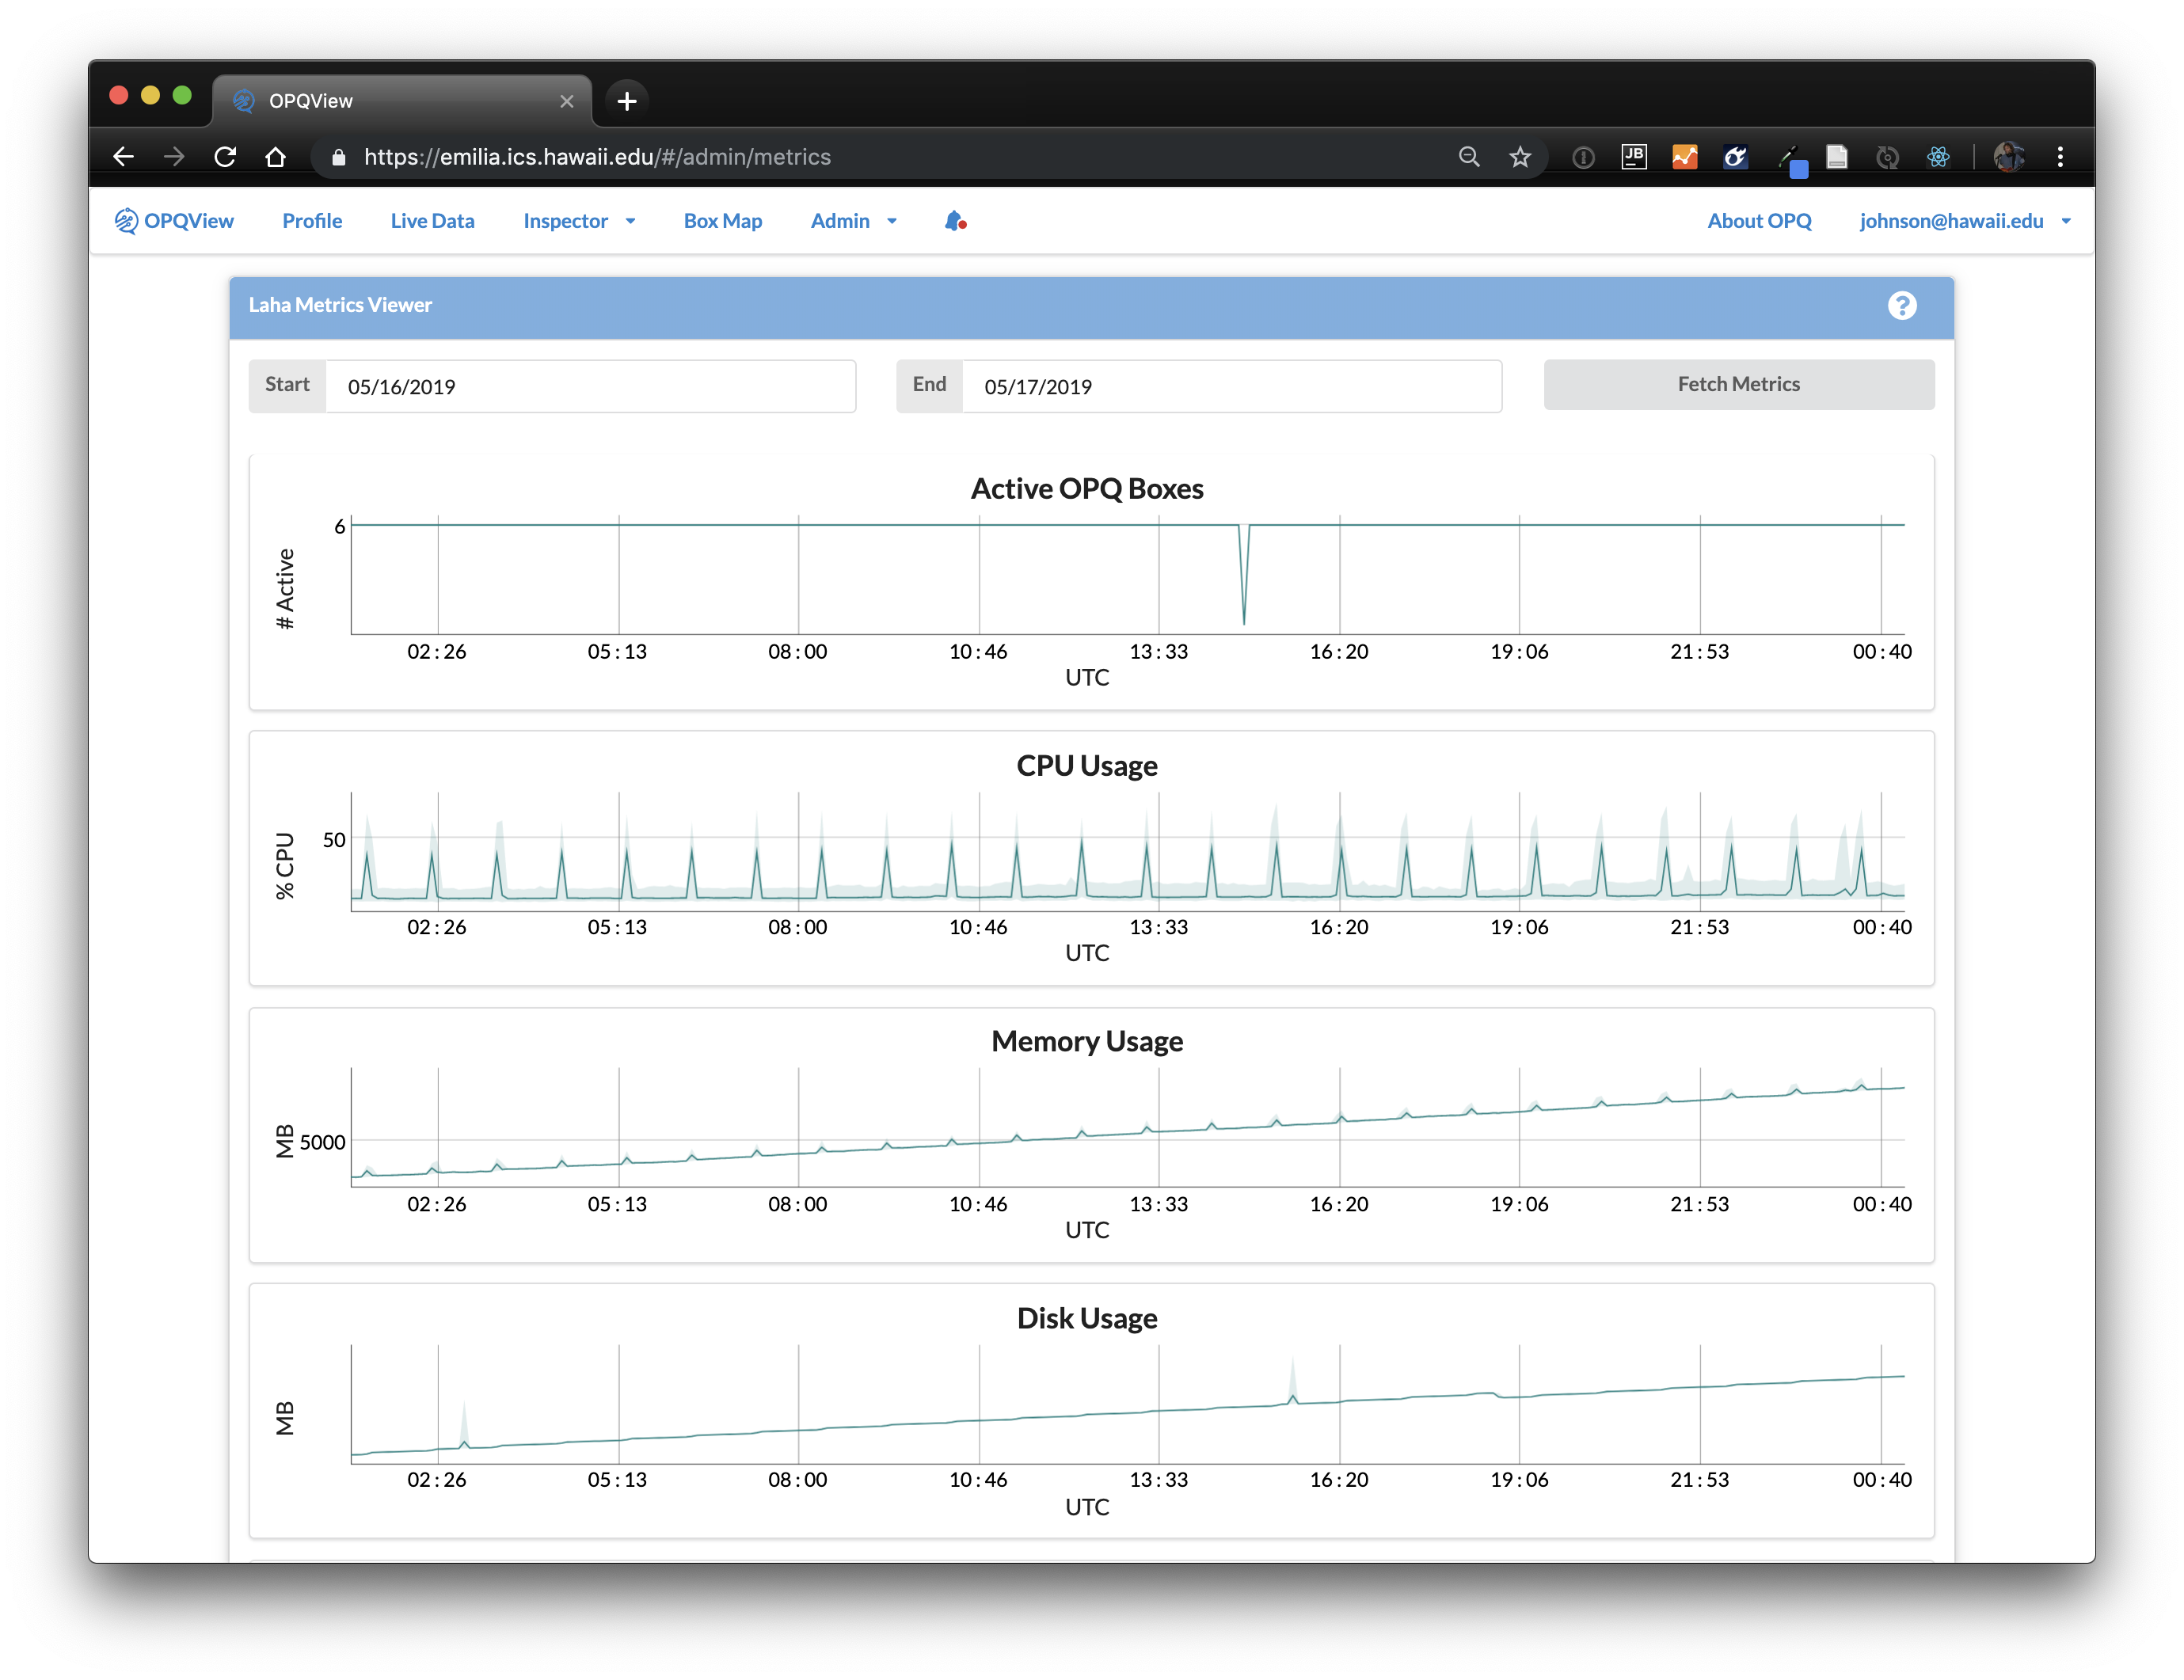
Metrics
The Laha Metrics Viewer allows the admin to display charts showing various performance related measurements of the system: