A beginner's guide to power quality
Power quality is a very complex subject, but to understand the overall goals of the Open Power Quality project, a simplified understanding should suffice.
Voltage, frequency, and "perfect" power quality
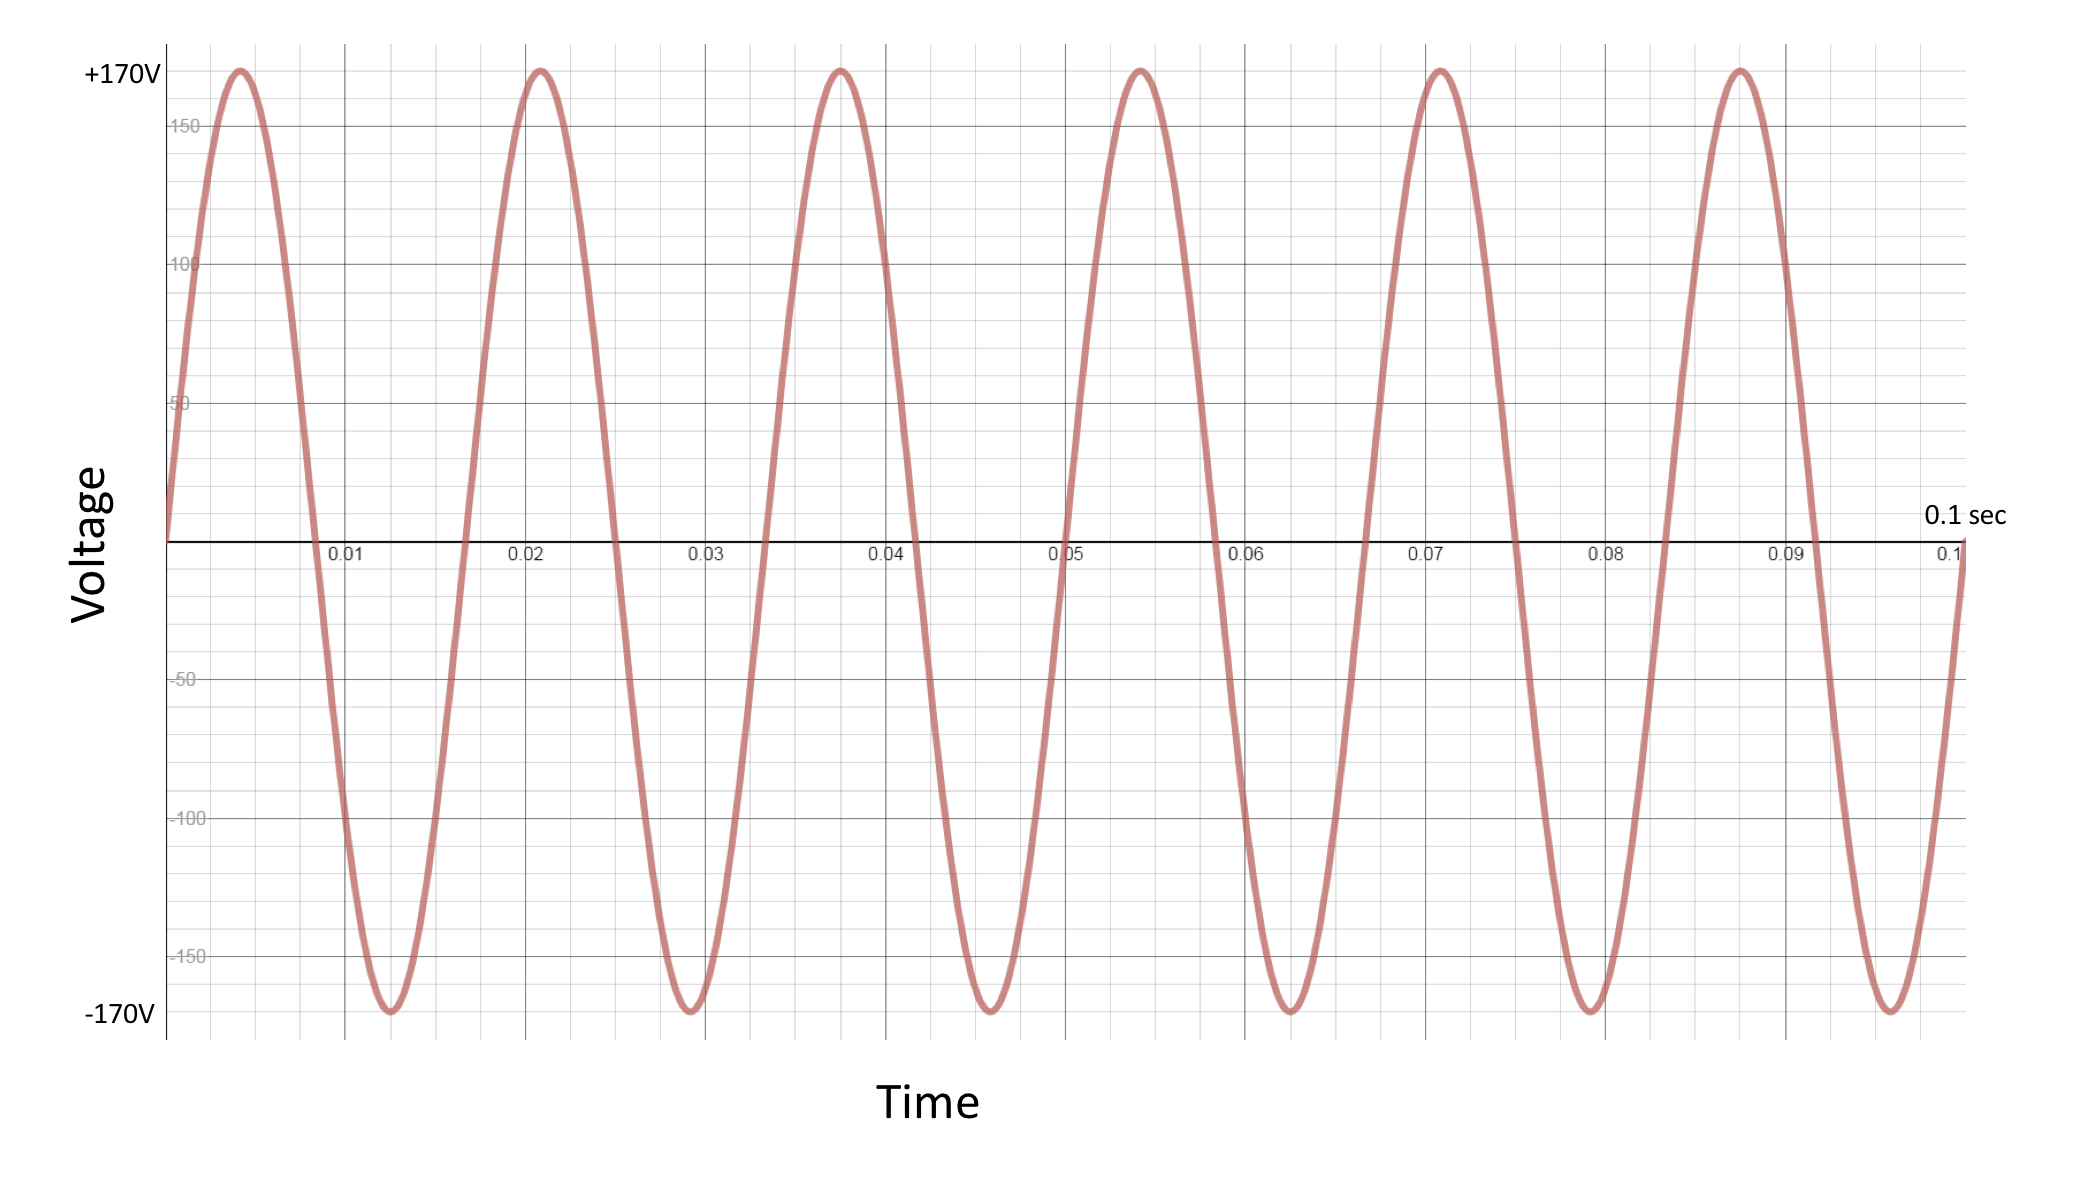
In OPQ, we are concerned with measuring the quality of power from a wall outlet, which means we focus on an approach to providing a kind of power called "alternating current" (AC). The following image illustrates what "perfect" quality AC power for U.S. wall outlets might look like:

This image illustrates three criteria that must be satisfied for AC power in US households to have "perfect" power quality:
- The voltage must vary from a maximum value of +170 volts to a minimum value of -170 volts.
- The voltage must switch between the maximum and minimum values exactly six times in a tenth of a second, or 60 times per second.
- The voltage must vary between its maximum and minimum values in a precise manner called a sine wave.
Even though voltage does not have a constant value in alternating current, it is useful to have a measurement consisting of a single number for voltage. By convention, a measure called "root mean square" (RMS) is used to represent the voltage in an alternating current, as it generally corresponds to the "average" value of the voltage. RMS Voltage for AC turns out to be approximately 70% of the maximum voltage, so the RMS voltage in our example is 170 Volts * 0.7 = 120 Volts. Put another way, if power is specified as 120 Volts RMS, then the voltage is actually varying between +170 Volts and -170 Volts. In the remainder of this discussion, we will use "Volts" as a shorthand for "RMS Voltage".
The rate at which the voltage switches back and forth between its maximum and minimum values in alternating current is called its "frequency", and the unit of measurement is called "hertz" (Hz). In this illustration, the voltage switches back and forth 60 times per second, which is measured as 60 Hz.
So, in the US, the standard for power from a wall outlet is 120 volts, 60 Hz AC. (Parenthetically, other countries have different standards. Australia uses 240 Volts, 50 Hz AC. Japan uses 100 Volts but some regions use 50 Hz AC while others use 60 Hz AC. For a full list, see List of Worldwide AC Voltages and Frequencies).
Types of power quality problems
For the purposes of OPQ, power fails to achieve "perfect" quality when one or more of the three criteria listed above fails to hold. Here are examples of how each of the three criteria can fail to be satisfied:
- If the max/min voltage is significantly less than +170/-170, the result is a power quality problem known as a "voltage lag".
- If the voltage varies between its maximum and minimum values more than 60 times per second, the result is known as a "frequency surge".
- Various situations can result in the insertion of "harmonics" into the power line, or voltage sine waves that are multiples of 60 Hz. These various waves combine together to form a new wave that is a distortion of the desired sine wave. "Total Harmonic Distortion" is a measure of the level of distortion of the voltage sine wave due to this problem.
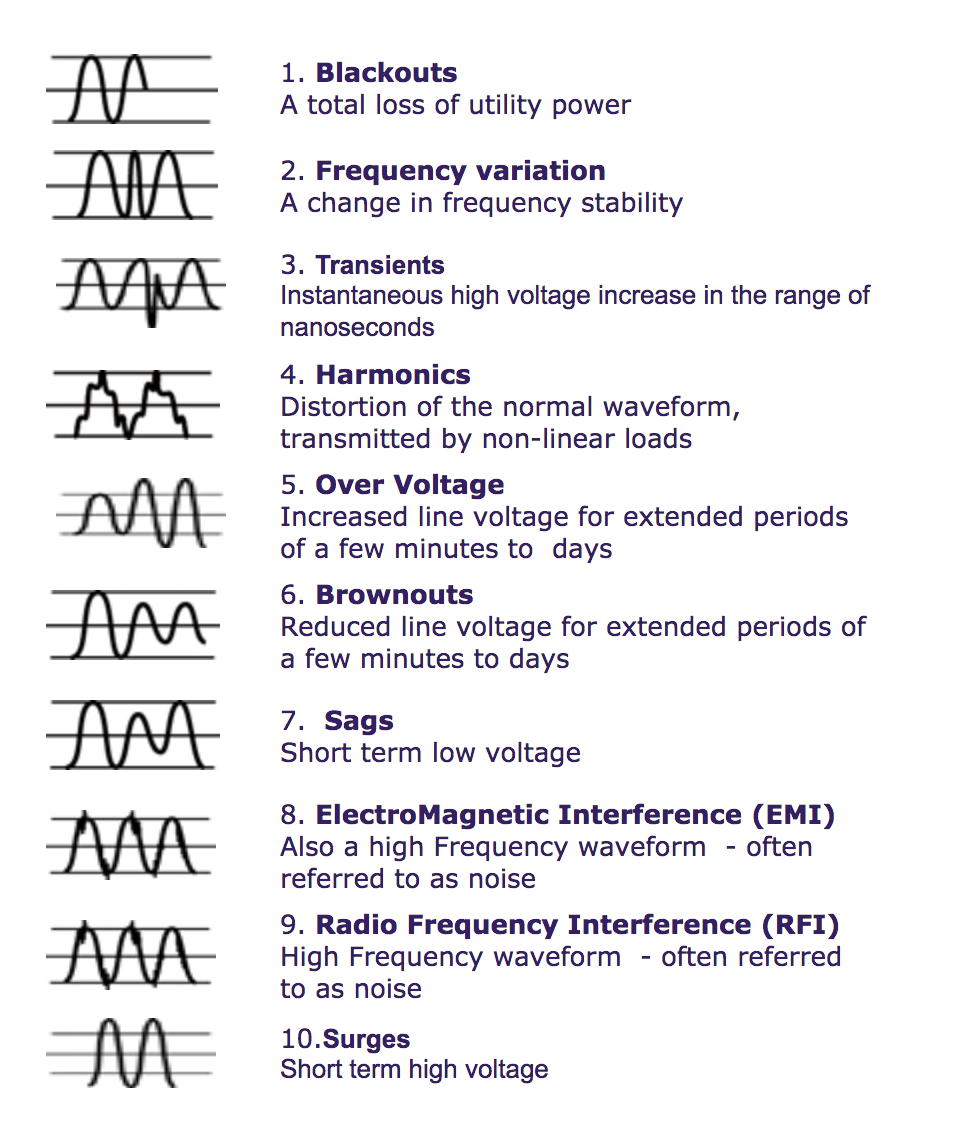
Most power quality problems relate to deviations in voltage. For example, the PurePower company created an illustrated list of ten common power quality problems, nine of which involve voltage-related issues:

As you can also see from this list, power quality problems are typically characterized by two things: (1) a change to the waveform, and (2) how long the change lasts. For example, a "transient" only lasts a matter of nanoseconds, while a "brownout" lasts at least a few minutes.
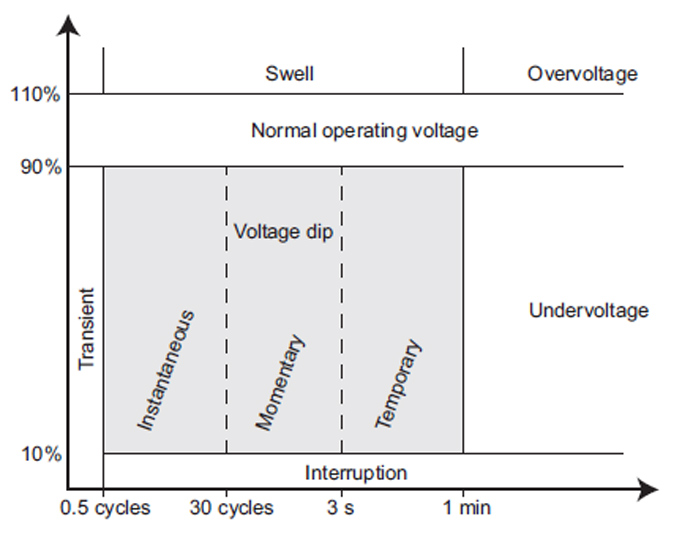
IEEE 1156 provides a characterization of voltage-related power quality problems which focuses only on the deviation of voltage from normal values and the duration of the deviation:

There are several power quality measures not currently calculated by OPQ Box, including power factor, telephone influence factor, flicker factor, and unbalance factor. Future research will determine if these metrics are important to achieving the goals of this project.
Causes of power quality problems
So, we know what constitutes "perfect" AC power, and we know the some of the common ways power can fail to achieve it. But why isn't power always perfect?
Causes of frequency deviations
First, let's look at frequency. As noted above, in perfect AC power in the US, voltage swings from +170 volts to -170 volts exactly 60 times a second. To understand why deviations in this frequency might occur, it is helpful to understand how this frequency value is established and maintained.
For large electrical grids, the frequency of AC power is defined by the speed of rotation of large AC generators, typically 3600 RPM for gas turbines. As demand for power fluctuates on a second by second basis, the speed of rotation will speed up or slow down in response, but utilities have become very good at maintaining the rotational velocity of their AC generators in the face of normal fluctuations in demand. So, for frequency to deviate significantly from 60 Hz, normal control procedures must have failed to keep the generators at their standard RPM. This can happen, for example, if demand for power exceeds the limits of the utility's capacity to provide it, or if sections of the grid suddenly disconnect from the main power sources.
Thus, because frequency is established and controlled at the source of power generation, substantial deviations from normal frequency values are traditionally rare in large electrical grids where most power is centrally generated and controlled by the utilities.
Interestingly, the rise of distributed renewable energy generation means that frequency deviation has the potential to become a bigger issue. If a substantial percentage of the power being provided to the grid is not provided by the large AC generators, then they might cease to dominate the way frequency is established and maintained.
Causes of voltage deviations
As noted above, voltage sags and swells are brief deviations from the normal swing in amplitude of the AC sine wave. By "brief", we mean from milliseconds to a second or so in duration. Fundamentally, voltage deviations occur when power generation into the grid does not match power consumption from the grid.
In contrast to frequency, which is established and controlled at the origin of power generation, voltage sags and swells can be caused at the end point of the electrical grid where the power is being consumed. Voltage sags can be caused by rapid increases in loads due to things like short circuits, motors starting, or electric heaters turning on. They can also be caused by household appliances drawing too much power in either your or your neighbour’s homes. Voltage swells can be caused by an abrupt reduction in load on a circuit, or by faulty wiring such as a damaged or loose neutral connection.
Distributed renewable energy sources like rooftop solar have the potential to cause local voltage sags and swells because they are generating power and placing it into the grid. If the utilities cannot control their centralized generation appropriately, then power consumption will not match power generation and a voltage sag or swell will result.
Transients can be caused by loose connections, lightning strikes, strong winds causing lines to clash, trees touching the line, vehicle accidents involving powerlines, or birds or other animals on the lines.
Industry standards
Not surprisingly, various standards have been developed to characterize power quality. Here are some of the most prominent.
IEEE 1159
IEEE 1159: Recommended Practice for Monitoring Electric Power Quality provides an overview of power quality monitoring, including descriptions of power quality phenomena, objectives for power quality monitoring, types of monitoring instruments, and various best practices for conducting power quality monitoring and interpreting the results.
ITIC (and CBEMA) Curves
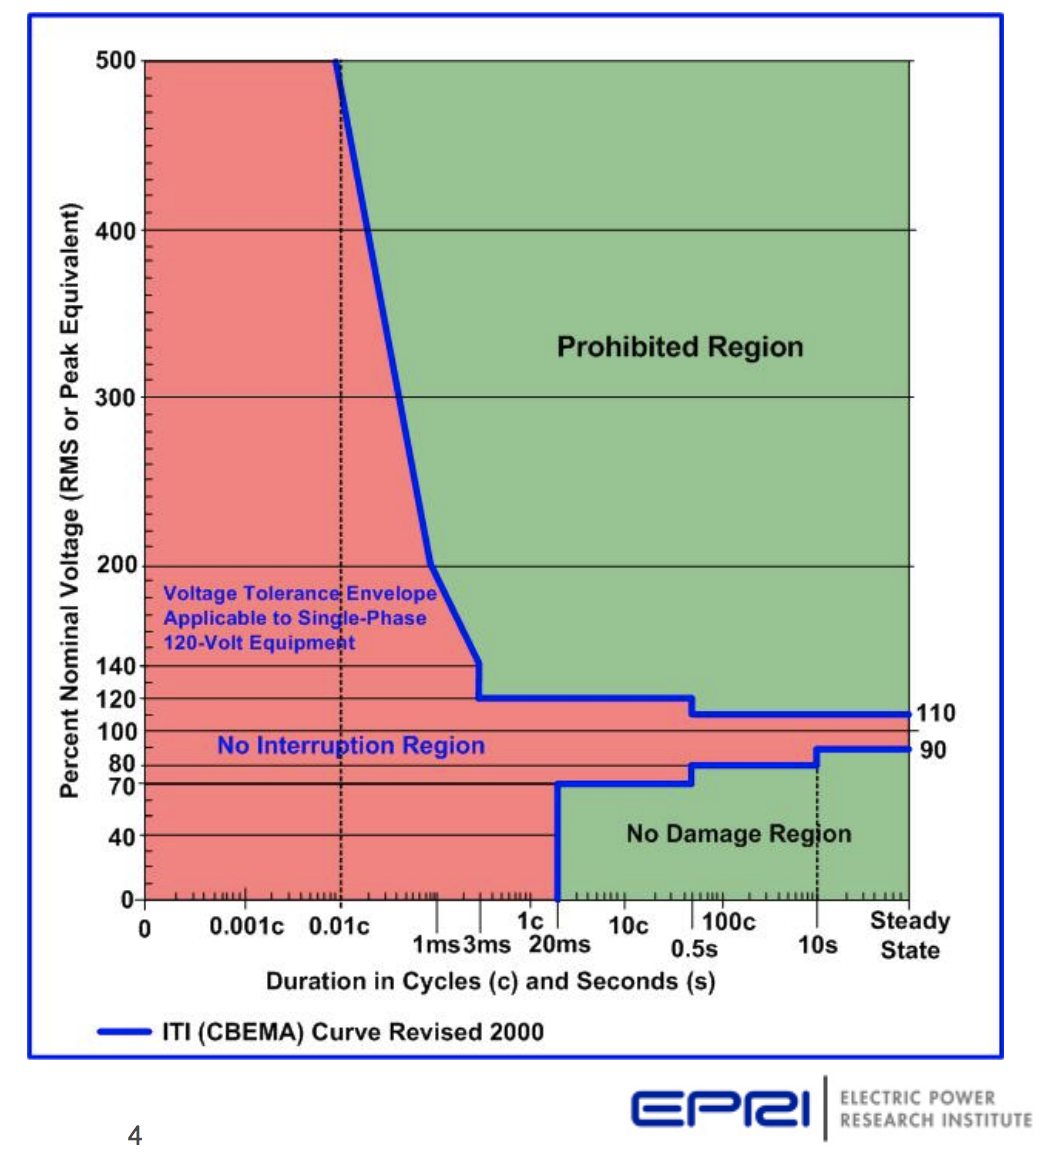
The Information Technology Industry Council (ITIC) has created a standard (called the "ITIC Curve") that specifies what kinds of power quality problems should be tolerated by electronic devices. The latest version of this standard was published in 1999, and it defines what kinds of voltage fluctuations should be tolerated by electronic devices. Basically, for very short periods of time, very large deviations from normal voltage should be tolerated, but as the length of time of the deviation increases, the amount of deviation that should be tolerated decreases:

Note that this standard is simply a recommendation, and there is no requirement that electronic devices actually observe this tolerance to voltage deviations. The ITIC Curve is a revision of the similar standard called the "CBEMA Curve" developed by the Computer Business Equipment Manufacturers Association in the 1970's.
SEMI F47
SEMI, the industry association for the semiconductor industry, developed a standard with similar goals to the ITIC Curve called SEMI F47-0706. It sets minimum voltage sag immunity requirements.
PQ and OPQ
There are many reasons why power quality might be monitored for problems. For example, electrical utilities monitor power quality in order to ensure the correct functioning of the grid. A manufacturing plant may monitor power quality in order to ensure that its equipment will not receive harmful power, and even to ensure that its equipment is not introducing harmful power problems into the grid. The kinds of power quality monitors used, and the data that is collected, depend upon the goals of the user.
In the case of OPQ, we are gathering power quality data to support goals such as the following:
(1) Consumer awareness of the potential impact of their power supply on their electronics. For example, computers are subject to data errors, crashing, or even destruction as a result of voltage deviations such as transients. This damage can be immediate, or the cumulative impact of multiple transients over time. OPQ increases consumer awareness about whether poor power quality could be a cause of any electronic problems they are experiencing.
(2) Impact on policies regarding distributed renewable energy. As noted above, incorporation of large amounts of distributed renewable energy can have adverse effects on both frequency and voltage. OPQ provides a novel, easy to deploy mechanism for gathering data about the quality of power, which can be used in conjunction with other data sources (network topology, solar insolation, wind speeds, other environmental factors) to improve modeling and thus ensure that renewable energy sources are being used as much as possible.
More about electricity monitoring
The folks over at Open Energy Monitor have produced an excellent tutorial on AC Power which goes into resistive vs reactive loads and real vs. reactive vs. apparent power.
