G1 Pilot Study (2014)
Overview
The OPQ (G1) pilot study began in early August, 2014 with the installation of three G1 OPQBoxes on Oahu. The three OPQBoxes were installed in three locations: a scientific laboratory building on the UH Manoa campus, an apartment complex in Honolulu, and a residence on the Windward side of Oahu.
Also at that time, an initial version of the OPQHub cloud service was deployed and began accepting data from the devices.
Both OPQBoxes and the OPQHub received updates during the pilot study. OPQBox updates improved duration recording and event throttling. The OPQHub cloud service underwent significant redesign of its user interface. These pilot study results will refer to the latest versions of hardware and software. In addition, one OPQBox was relocated from its Windward Oahu location to a Honolulu location during the pilot study.
The goals of the OPQ G1 Pilot Study were:
- To validate communication between OPQBoxes and an OPQHub.
- To obtain preliminary, uncalibrated data about grid stability on Oahu.
- To obtain requirements for the design of the G2 OPQBox and OPQHub.
Data summary
After approximately two months of data collection, the devices generated over 8000 voltage events (i.e. voltages outside the range of 114 - 126 V, exceeding the 5% variability for normal operation established by HECO). The devices also generated 16 frequency events (i.e. frequency fluctuation outside the range of 59.5 - 60.5 Hz).
All of the frequency events were less than 1 second in duration. Only the Windward Oahu OPQBox observed frequency events.
Voltage events ranged from 90 V to 140 V. Most of the voltage events were on also the order of 1 second in duration, though 21 events were longer than 60 seconds. The longest recorded voltage event was 255 seconds.
In addition to recording events (where voltage or frequency exceeding threshold values), the OPQBox also implements a "heartbeat" communication to the OPQHub to establish its liveness every 15 seconds. As part of the heartbeat communication, the OPQBox sends the current voltage and frequency. This provides a way to show frequency and voltage at the granularity of 15 seconds.
We also implemented a simple analytic to classify events according to the ITIC/CBEMA power tolerance curve. During the pilot study period, our devices detected two abnormal power quality events according to this metric. These were both detected on the Windward side of Oahu and involved a voltage sag to 90V of 7 seconds and 16 seconds.
General results
First, we feel that all of the goals for this pilot study were met in general. The OPQBoxes were able to successfully communicate with the OPQHub. Each of the three OPQBoxes collected several thousand voltage events. Both OPQBoxes and the OPQHub appeared relatively stable. Our results also appear to demonstrate the possibility of grid stability issues on Oahu, although we are not yet confident enough in our design to make firm conclusions.
Second, the pilot study has raised questions in our minds regarding the use of ITIC as an analytic for determining the severity of power quality events. For example, ITIC only deals with voltage and does not take into account frequency or THD. Second, it does not take into account the possibility of "additive" impact: the possibility that several thousand "small" events could add up to a significant impact on modern electrical components.
Third, we are not yet absolutely confident of the data processing capabilities of our first generation hardware. We need to determine ways to better validate the accuracy and reliability of OPQBoxes in future generations.
Analysis results
So far we have discovered the following from analysis of the G1 Pilot Study data.
Impact of PV
Our first result comes from an OPQBox installed in a Kailua residence that also had photovoltaic panels. We compared PV power generation to voltage for eight days in August and observed a distinct correlation as shown below:
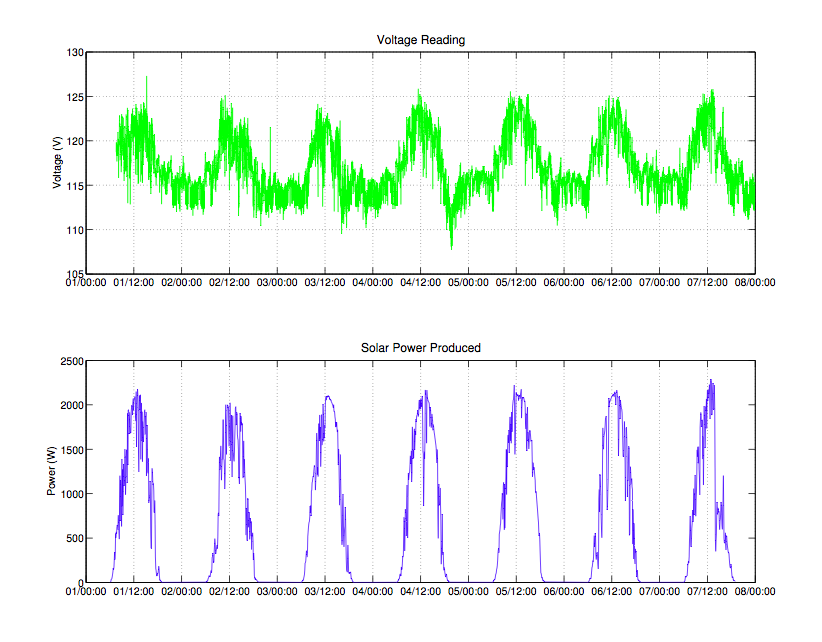
In addition to the overall correlation, more fine-grained correlation is also visible. On the last day shown on the graph, a precipitous drop in PV output around 1pm is also correlated with a drop in voltage.
This correlation provides evidence for a local impact of PV on voltage. The next question is whether or not PV impacts the grid as a whole. To explore this, the following graph compares PV power generation in the Kailua residence to the voltage values collected by an OPQBox installed in an apartment in Honolulu, over 10 miles away. This chart continues to show a correlation:

Assuming the weather was uniform across the island during this day (and so the Kailua PV values are representative of grid-wide PV production), this chart appears to demonstrate the impact of grid-wide PV on the grid itself.
To further test this correlation effect, the following chart shows PV generation and voltage during Hurricane Ana:
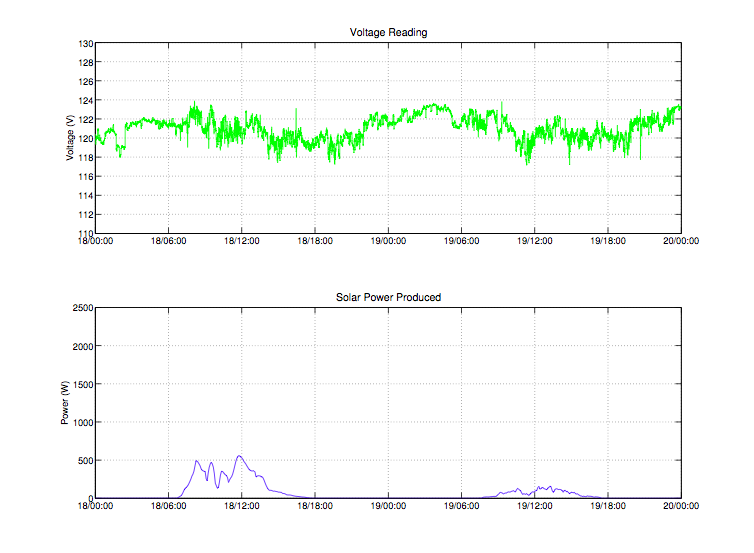
In this case, with almost no PV generation, the cyclical fluctuations in voltage disappears.
Grid event detection
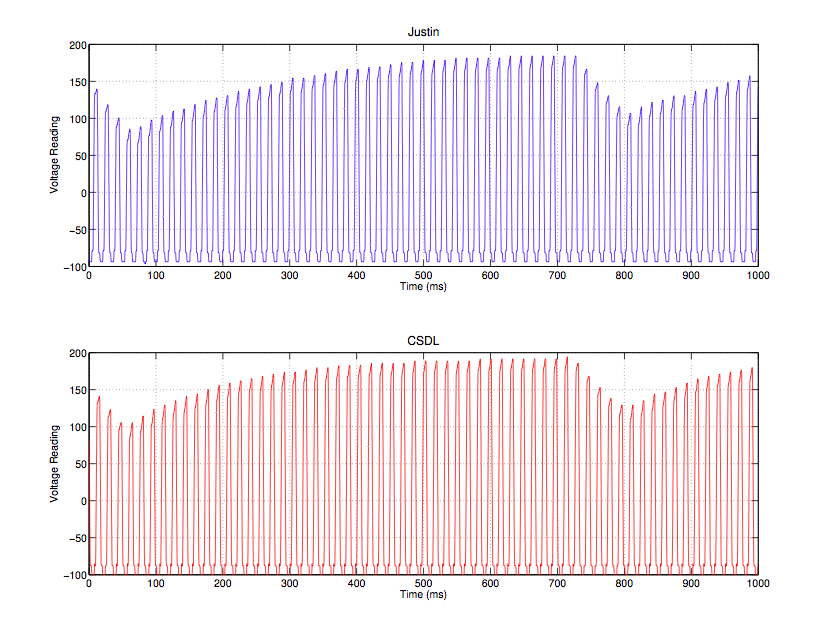
A primary goal of the OPQ project is to be able to differentiate between local power quality events and grid-wide power quality events. Analysis of pilot study data confirmed that we are able to detect grid-wide events. Here is a chart showing a voltage sag detected by two OPQBoxes approximately 10 miles away from each other. The voltage sag lasted 6 cycles and was separated by 700 ms. The timestamp between the two devices differed by 18ms, which is reasonable considering our use of NTP synchronization.
OPQBox Results
Schematics and other documentation for the G1 OPQBox can be found in the OPQBox1 repository.
OPQBox Goals
We designed the G1 OPQBox with the following goals:
- Unit price below $60 to support large-scale deployment
- Easy to install and safe to operate
- 16/24 bit resolution and 50+ samples per grid cycle
- Support for frequency and voltage measurement
- Onboard processing and local storage
- Inter-device synchronization via NTP
- Ease of extensibility
- Open source license and development process
Here is the G1 OPQBox block diagram:

For safety, the G1 OPQBox is galvanically isolated from the power grid via a UL-listed wall plug transformer. This transformer is used both for powering the meter and monitoring the power grid. The output of the transformer's secondary windings is passed through a low-pass filter which is responsible for scaling down the voltage to the analog-to-digital converter(ADC) range, as well as filtering out frequencies above 1Mhz. In addition, this filter protects the sensitive inputs of the ADC.
The output of the filter is digitized using an ADC on an MSP430AFE microcontroller. This microcontroller is specifically designed for power metering. The G1 OPQBox combines an analog front-end, a 24bit SAR ADC capable of sampling at 4kHz, and a 16bit MCU into a single integrated circuit to reduce the bill of materials. Here is a picture of the G1 circuit board:

To enable the sensor network to scale, a significant amount of processing must be performed on the device itself. This includes power quality event detection, as well as buffering of historic data leading up to the event. Furthermore, event data needs to be uploaded to the cloud for further analysis.
Currently, we use a Raspberry Pi single board computer for the main processing unit. The MSP430AFE sends digitized samples to the Raspberry Pi via the SPI protocol. Data is compared to the expected waveform, and if the deviation is significant, an event containing the raw data is send to the cloud via a USB 802.11 adapter.
OPQBox Findings
While the G1 OPQBox generally satisfied the design goals, the G1 Pilot Study revealed a number of issues:
Impact of NTP-based synchronization on analysis. The G1 design relies on NTP (Network Time Protocol) to synchronize the clocks of the OPQBoxes. Most utility-grade power quality devices (such as PMUs) use GPS in order to get nanosecond-level synchronization. We chose NTP because this reduces the cost of device hardware significantly as well as simplifies installation and use. We need to perform more research to determine the level of synchronization we are obtained between OPQBoxes, and what impact the use of NTP has on the kinds of analyses we can support.
Event recording upon power cutout. Our current hardware has no battery backup, which means in the event of a complete loss of power, the device will not have time to shut down and record the wave form prior to cut-off. We will rectify this design shortcoming in the G2 design.
Separate transformers for power and data. In the G1 design, a single transformer was used to both power the device and to collect data. We believe this can be a source of significant noise in the data stream.
OPQHub Results
Software and installation information can be found at the OPQHub Repository.
OPQHub Goals
We designed the G1 OPQHub with the following goals:
- Receive and store events from OPQBoxes.
- Support basic configuration by users.
- Provide a useful public interface for viewing events.
- Provide map-based location "coarsening" for privacy
- Provide very basic alert-based analytics to inform users when events occur.
- Implement the ITIC algorithm for determining event impact.
The G1 OPQHub is a two-tier web application using the Play Framework and MySQL. It is deployed on a virtual server (2 Intel Xeon X5690 CPUs at 3.47GHz, 32 GB RAM, 100 GB solid state disk) at the University of Hawaii.
Here is a screen image of the OPQHub home page as of the end of the G1 Pilot Study period:
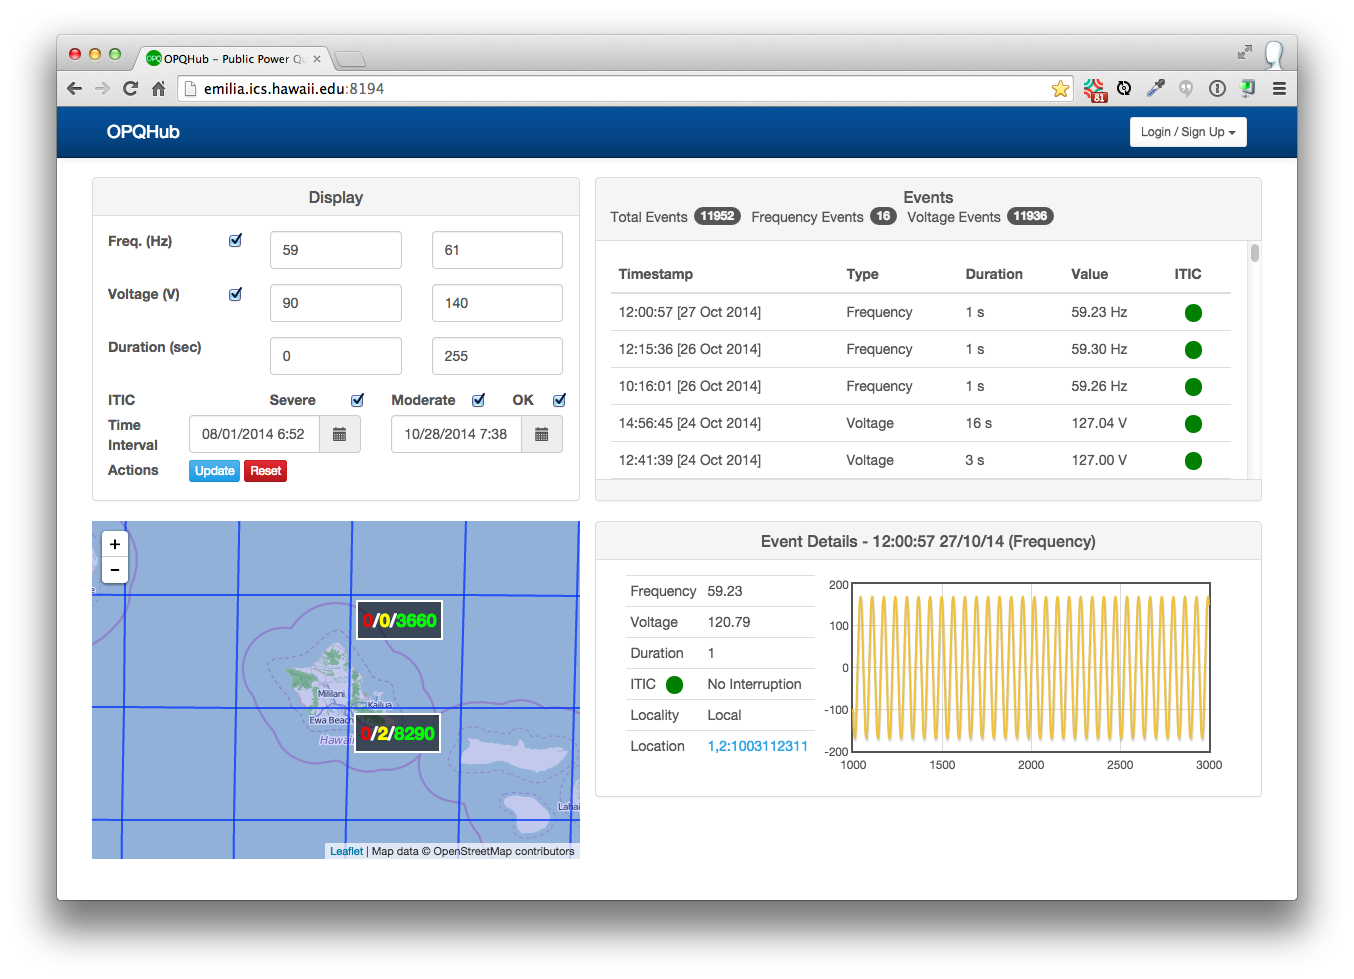
This page illustrates the many of the basic features of the G1 service: display of event data, map-based viewing of events, and ITIC characterization. The "Display" pane allows the user to filter the displayed events by a variety of criteria. In addition, the default values and other displays in the home page provide useful summary statistics about the range of values contained in the database. For example,
- Frequency varies from approximately 59 Hz to 61 Hz (rounded to integer values).
- Voltage varies from 90 to 140 V.
- The maximum duration of an event was 255 seconds.
- Data has been collected since August 1.
- The database contains 11,952 events, of which 16 were Frequency and the rest Voltage.
The home page allows the user to filter in order to isolate events of interest. By deselecting the "OK" button and updating the display, the display shows two events falling outside the normal range according to the ITIC standard:
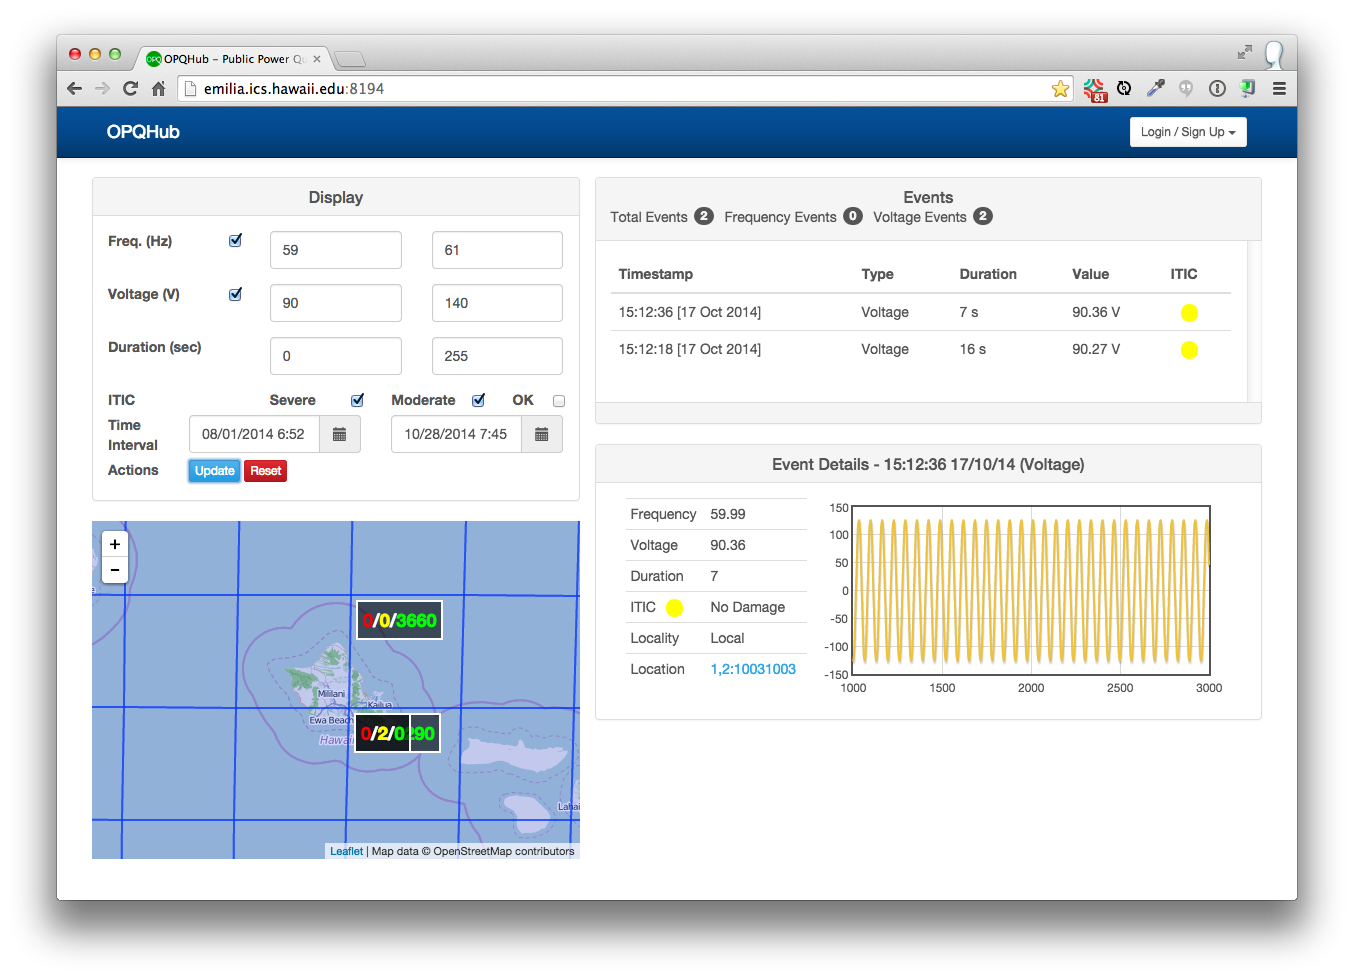
Adjusting the duration reveals the events with long duration:
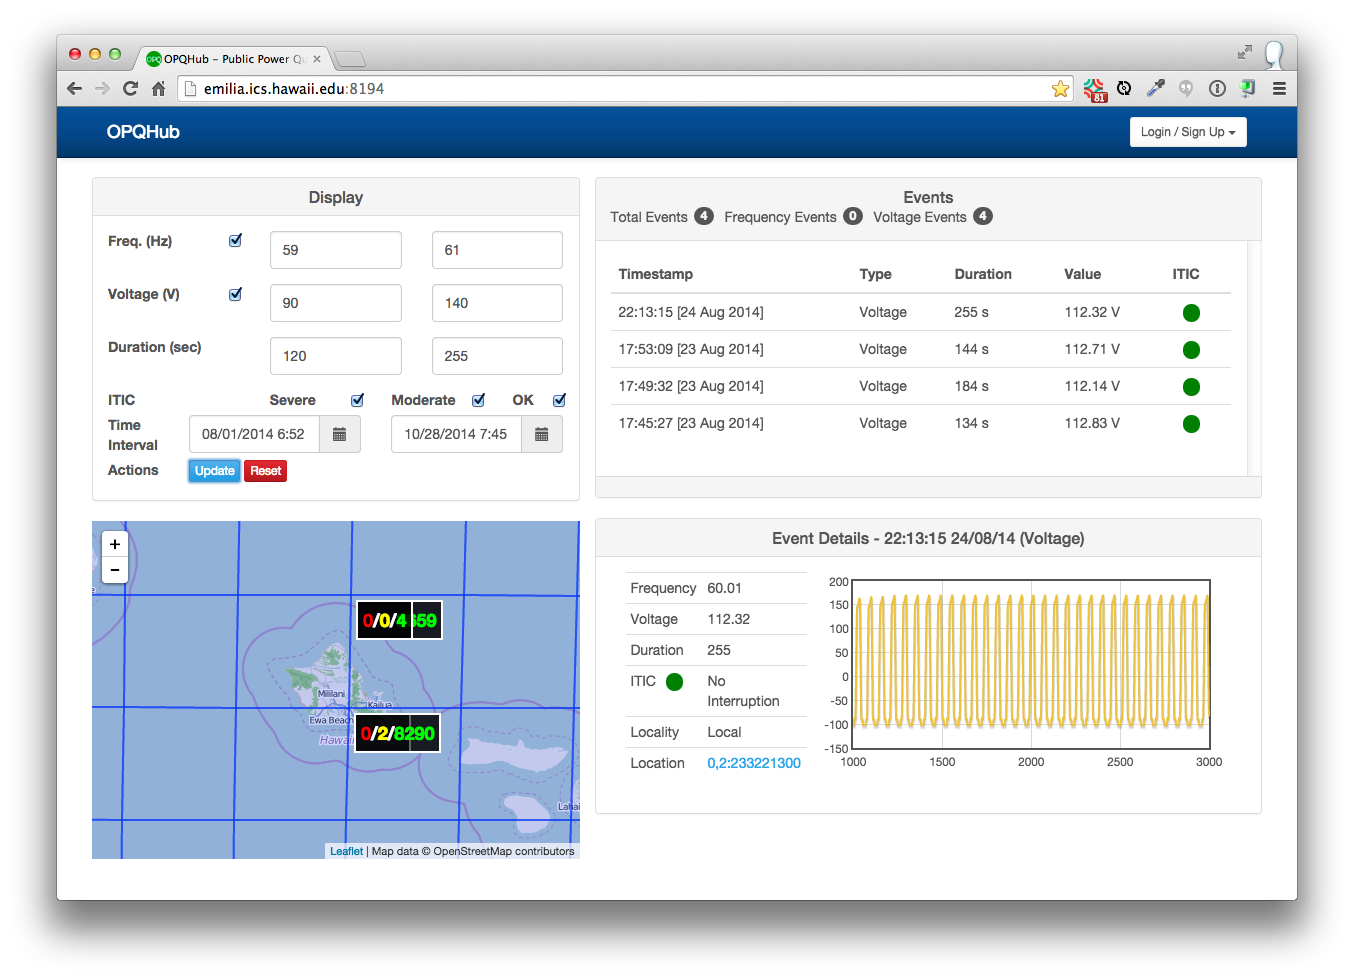
Finally, zooming the map provides more details on the location of various events:
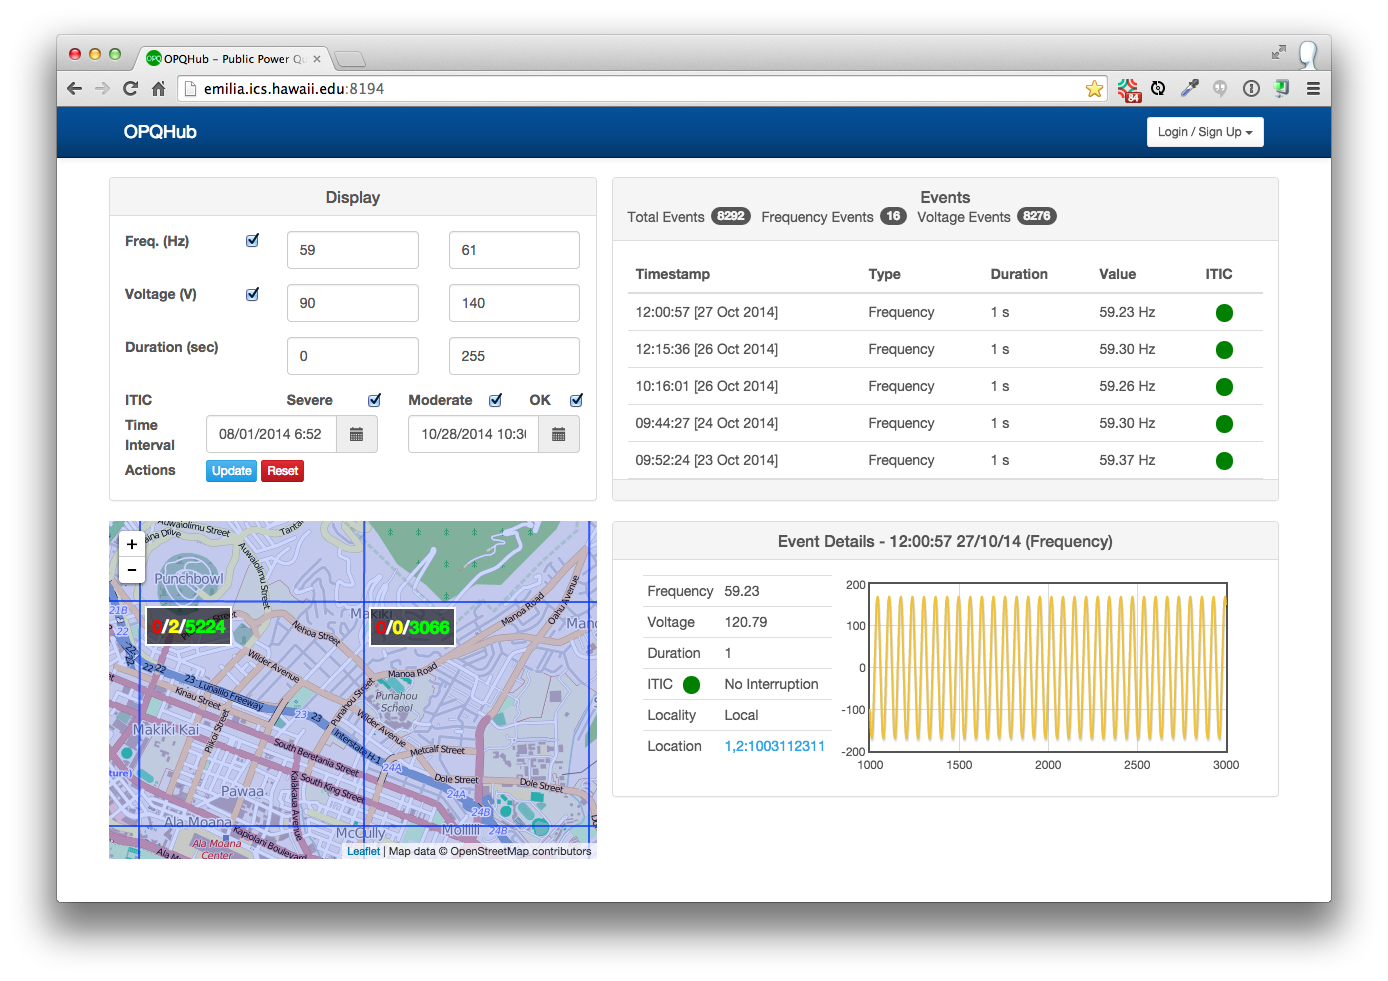
OPQHub Findings
While the G1 OPQHub also satisfied the design goals at a high level, the G1 Pilot Study revealed a number of issues:
Usability. The G1 Pilot Study revealed that the design of a highly usable public interface is a non-trivial undertaking. The home page UI was completely redesigned at the start of the pilot study, and it continues to undergo significant evolution. At the conclusion of the G1 Pilot Study, the design is not yet stable enough to support a usability study using naive users.
Performance. The performance of the system was found to be satisfactory, however we do not expect the current architecture to scale beyond at most a few thousand OPQBoxes.
Communication Protocol
Our first generation system also includes the design and implementation of the OPQ Communication Protocol for data transmission to reduce the bandwidth required.
The device and cloud service communicate using server-side events (SSE) over HTTP, which enables the device to be sent commands from the cloud even though it might be located behind the firewall of a home wireless router.
Our findings from the G1 Pilot study were:
Need for bi-directional control. We believe that the protocol should be expanded to allow OPQHub to request additional information from devices (or to alter threshold settings). This will require additions to the communication protocol.
